Figure 6. Impact of cell density and TGF-β stimulation on Snail and N-cadherin expression in ARPE-19 cells. A: Cellular localization of Snail (red) and N-cadherin (green) at 2 days after passage. Nuclei were counterstained with Hoechst
33258 (blue). B: Cellular localization of Snail (red) and N-cadherin (green) at 7 days after passage. C, D: Cellular localization of Snail (red) and N-cadherin (green) after C TGF-β stimulation (10 ng/ml) and D PBS at 7 days after passage. Scale bar=50 µm.
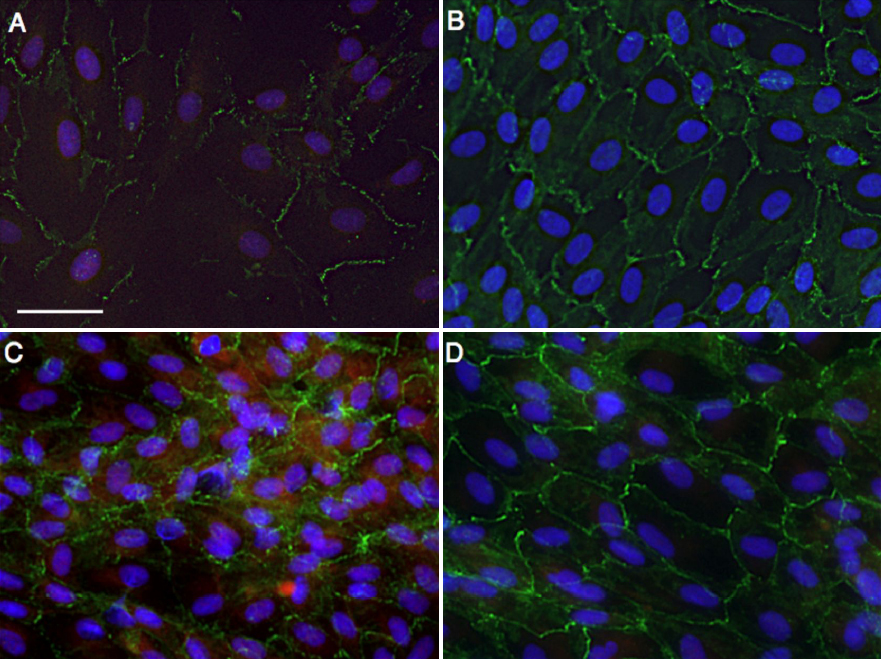
 Figure 6 of
Hirasawa, Mol Vis 2011; 17:1222-1230.
Figure 6 of
Hirasawa, Mol Vis 2011; 17:1222-1230.