Figure 3. Co-localization of Snail protein and α-SMA in human CNV. Micrographs of a representative section of human CNV. A: Phase contrast image. B: Fluorescent micrograph of α-SMA (yellow), Snail (red), and cell nuclei (blue). C: Consecutive section stained for RPE65 (green), Snail (red), and cell nuclei (blue). D: High magnification of B. Arrows indicate the co-expression of α-SMA and Snail in RPE cells. Scale bar shown in A and D=50 µm.
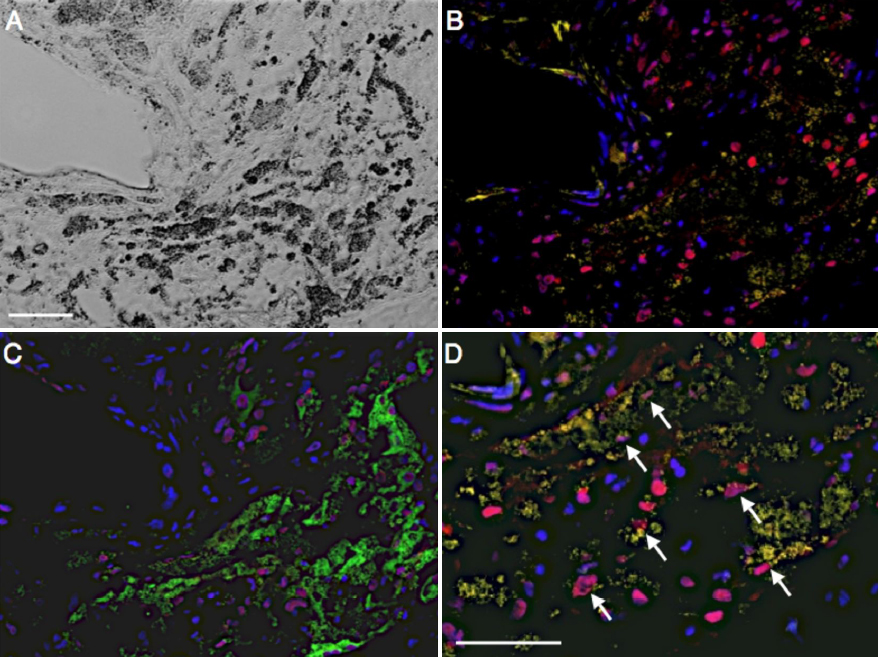
 Figure 3 of
Hirasawa, Mol Vis 2011; 17:1222-1230.
Figure 3 of
Hirasawa, Mol Vis 2011; 17:1222-1230.