Figure 2. Real time PCR confirmation of
selected genes affected by PITX2 siRNAs. All genes tested were
among PITX2-filtered genes except DKK1 and KCNJ2.
For
each TM, the four pair of bars show log2 fold change in
expression based on data of each of two PITX2 siRNAs compared
to each of two controls exposed to scrambled siRNA. Standard deviations
for real time PCR data are shown. See text for further details on real
time PCR experiments.
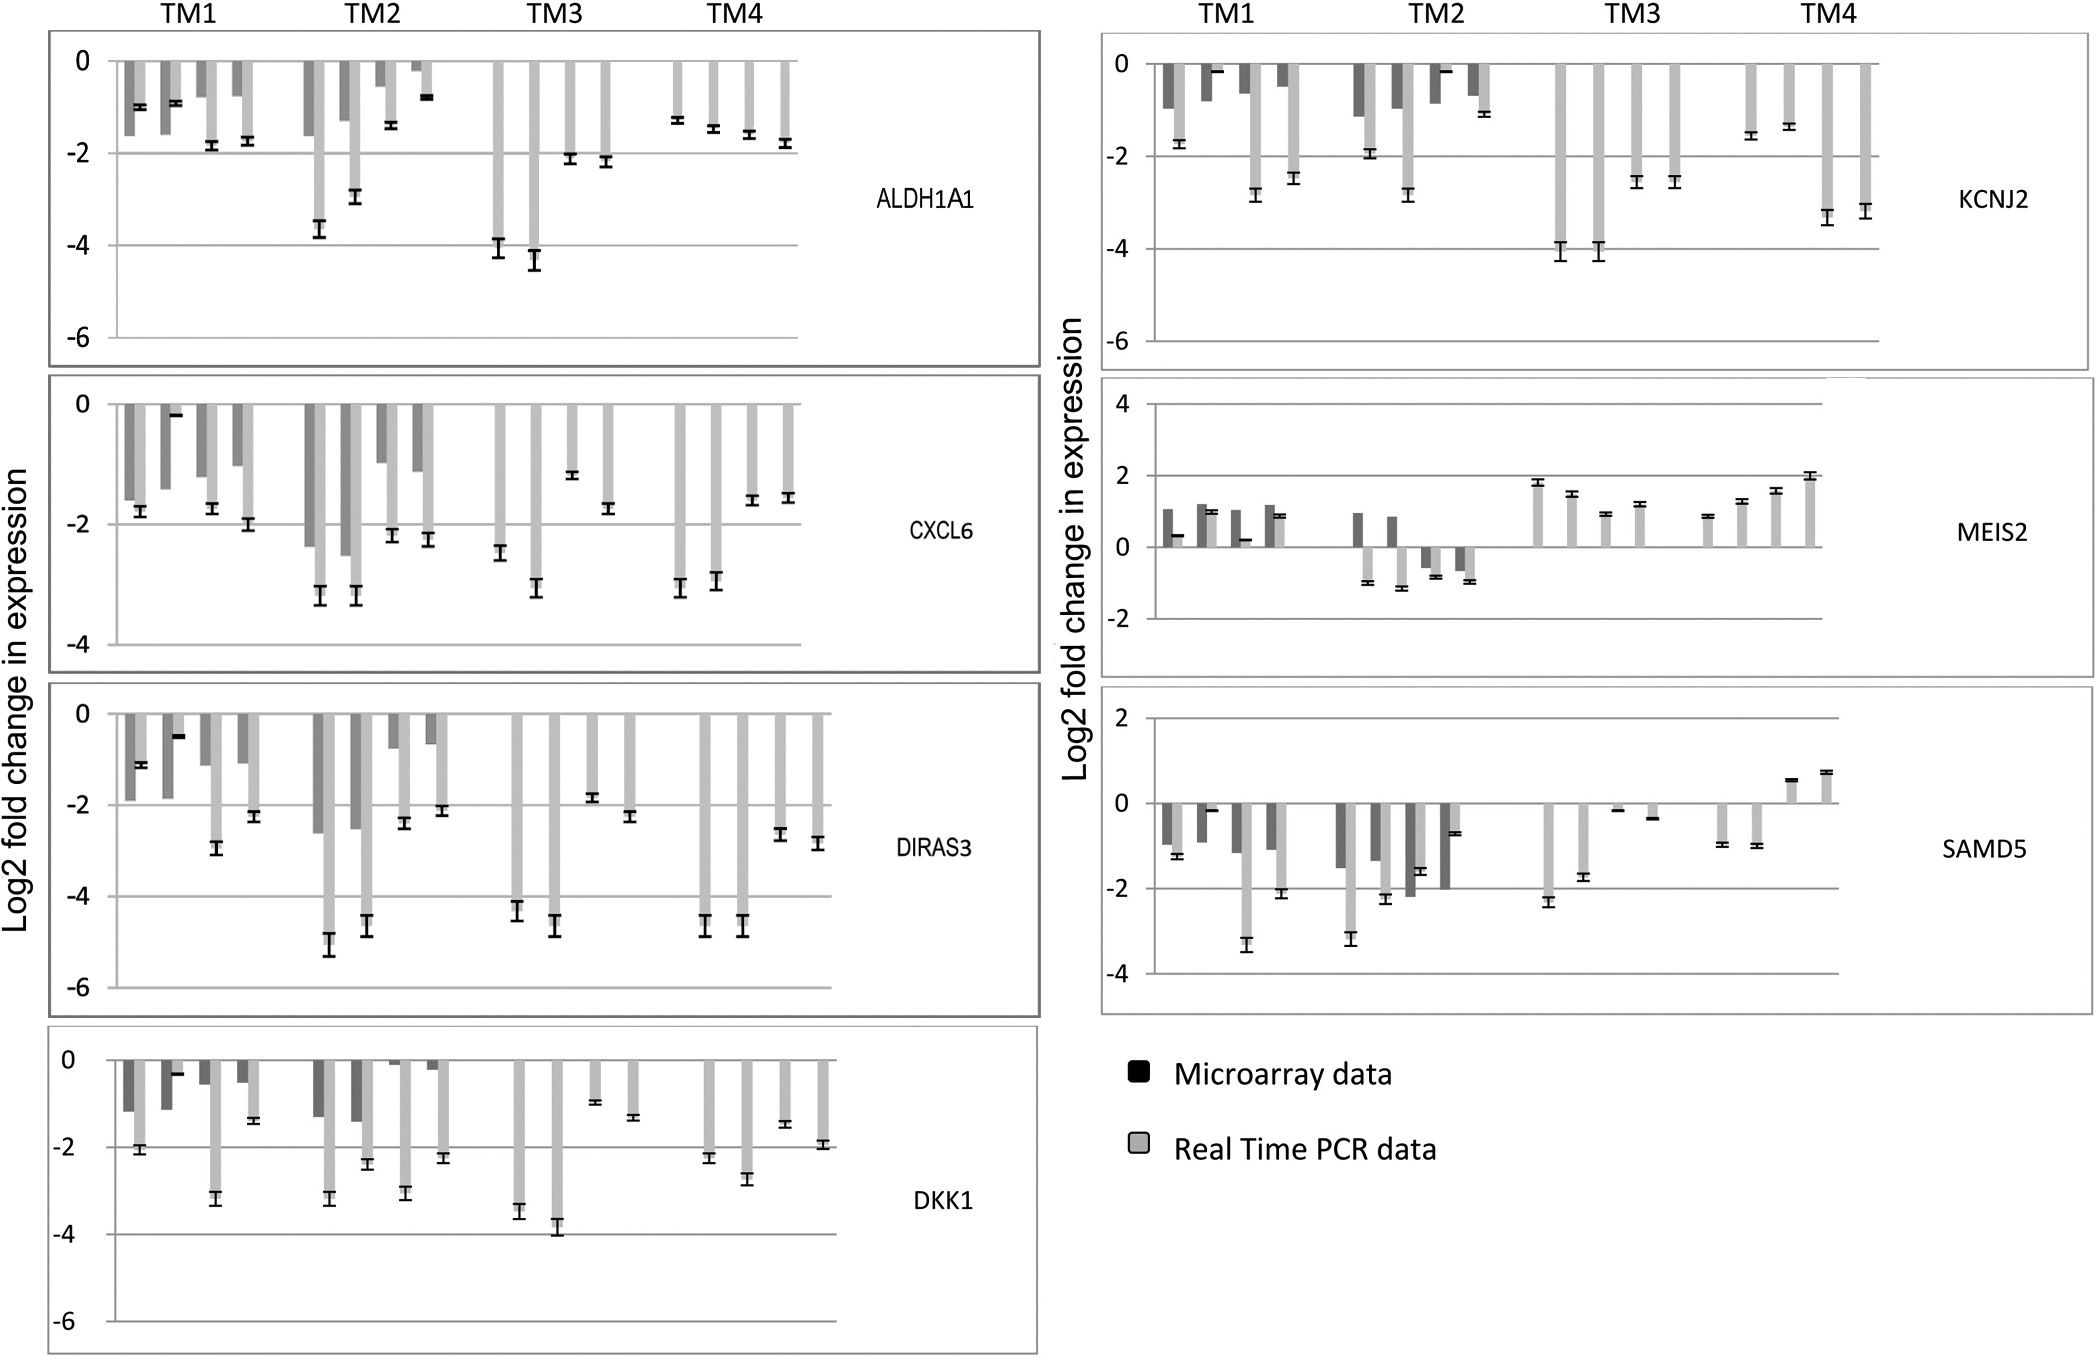
 Figure 2 of Paylakhi, Mol Vis 2011; 17:1209-1221.