Figure 3. GLC cells show elevated cytosolic Ca2+. Flow cytometry was performed in Fluo-4/AM loaded NLC and GLC cultures. LC cells were contained in 1 ml isotonic Ca2+ free solution and the fluorescence intensity was measured. Addition of 2 mM extracellular Ca2+ induced a rise of cytosolic Ca2+ in both NLC and GLC and this response was is more intense and has greater variability in the GLC cells than in normal control
LC cells. Results shown are tracings of a typical experiment with similar results observed in 3 separate experiments.
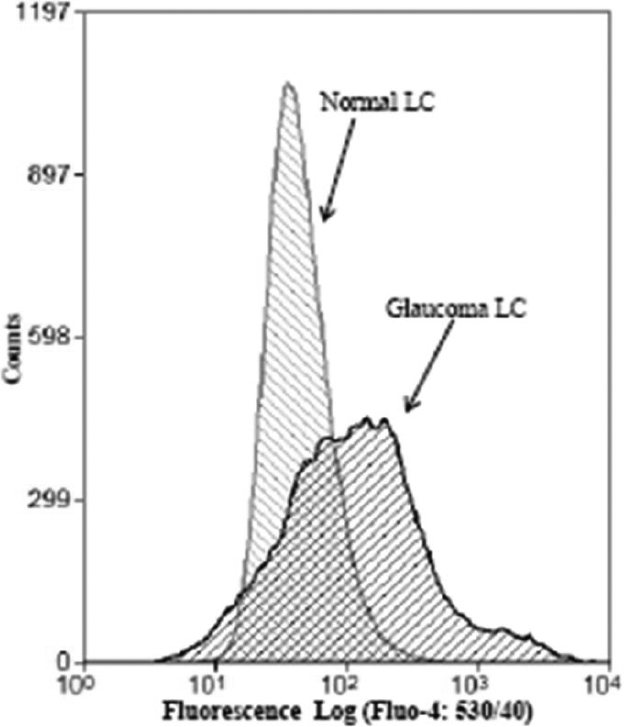
 Figure 3 of
McElnea, Mol Vis 2011; 17:1182-1191.
Figure 3 of
McElnea, Mol Vis 2011; 17:1182-1191.