Figure 1. The trend of subretinal fluid reduction measured by optical coherence tomography at baseline and follow up visits at 2, 4,
6, 8, 12, and 16 weeks after the onset of treatment. The sample size was 25 cases for treatment group and 25 cases for control
group throughout the study.
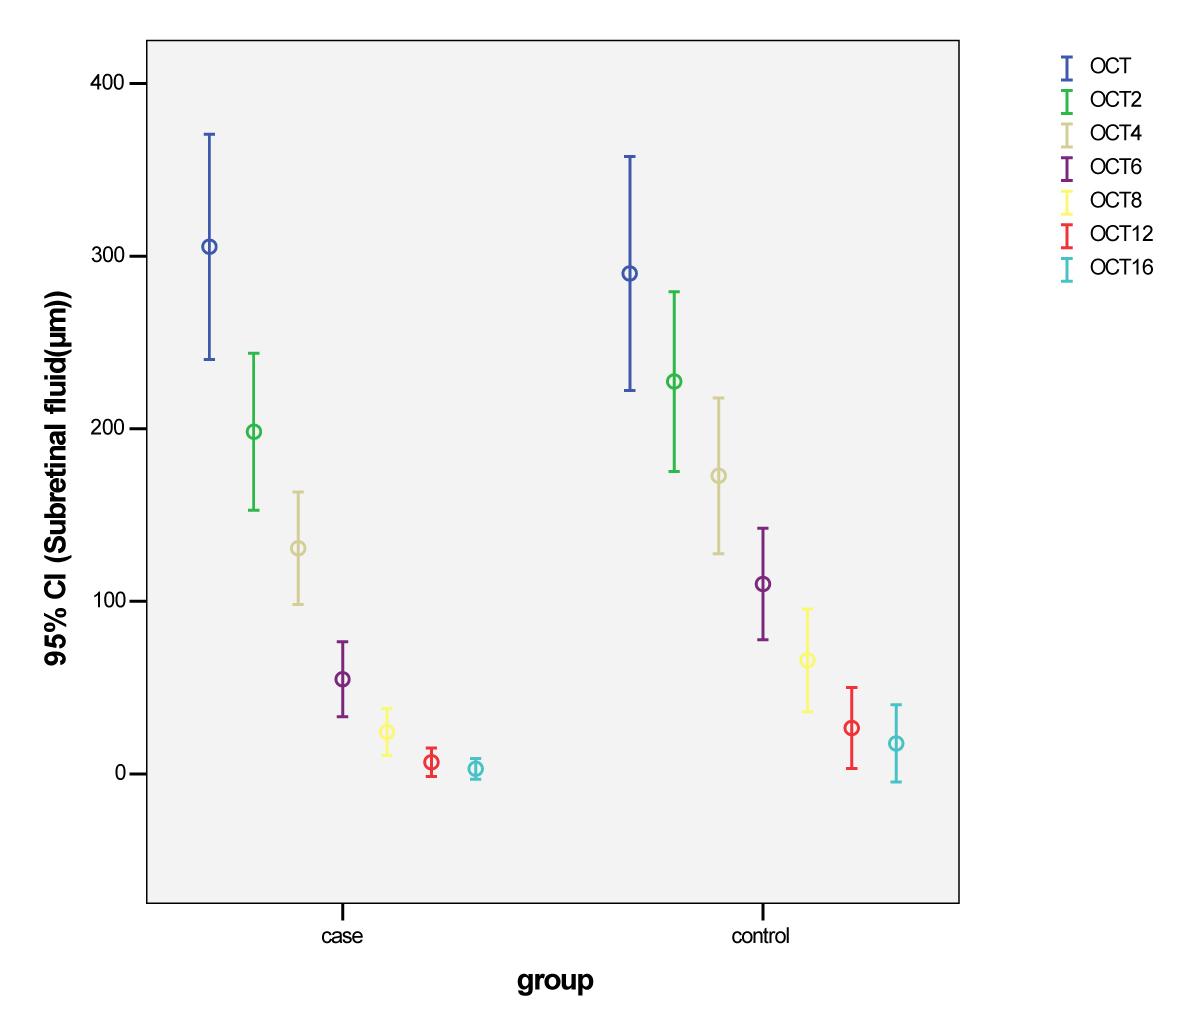
 Figure 1 of
Rahbani-Nobar, Mol Vis 2011; 17:99-103.
Figure 1 of
Rahbani-Nobar, Mol Vis 2011; 17:99-103.