Figure 1 of
Bellner, Mol Vis 2011; 17:1144-1152.
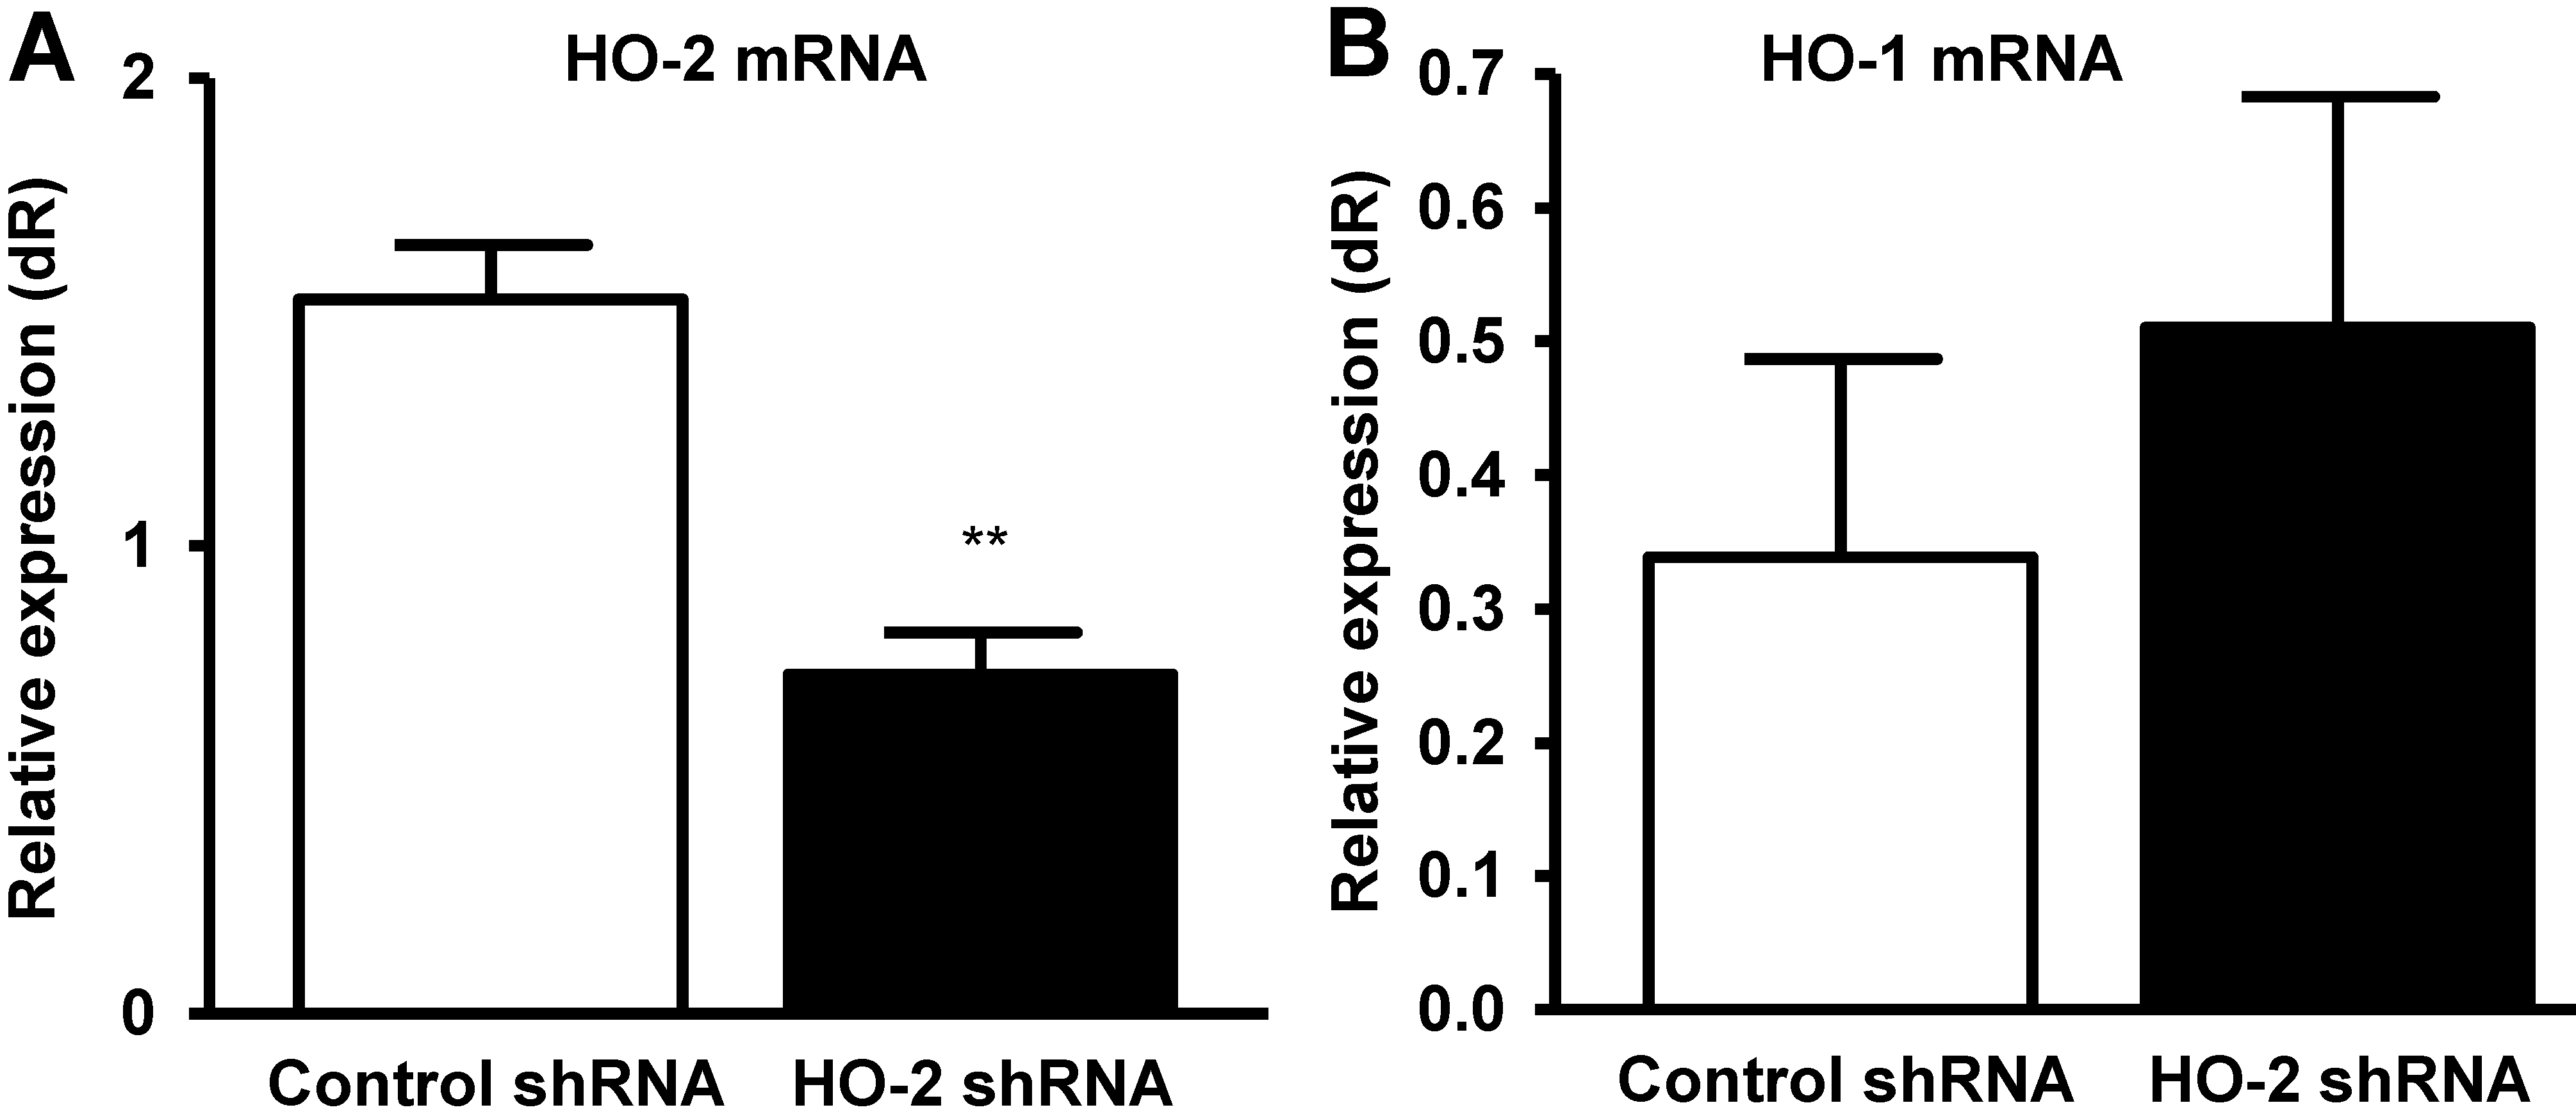
Figure 1.
Effect of local
HO-2
knockdown on
HO-2
and
HO-1
mRNA levels. Corneal
A
:
HO-2
, and
B
:
HO-1
mRNA levels after control- and
HO-2
-shRNA-treatment. (**p<0.01 from control-shRNA-treated mice, n=2–4).
 Figure 1 of Bellner, Mol Vis 2011; 17:1144-1152.