Figure 1. POAG susceptibility association tests for 4,280 SNPs on human chromosome 2p14–21. Negative logarithms (base 10) of p-values
(y-axis) calculated for SNP association with susceptibility to POAG using the logistic regression analysis with adjustment
for age and gender are plotted against the SNP chromosome positions in megabases (x-axis). These SNPs span 25 megabases from
chromosome position 43,146,705 (chromosome 2p21) to 68,145,622 (2p14), and include the 20 typed (filled diamond) and 4,260
imputed ones (empty circle) that were not monomorphic. This region encloses the three POAG-linkage loci previously reported
for Caucasian, Chinese, and Barbadian families. The three typed SNPs previously reported for the Barbadian association (in
bold) and the four imputed SNPs showing the lowest p-values (italicized) are marked by their reference SNP accession ID's
(rs numbers).
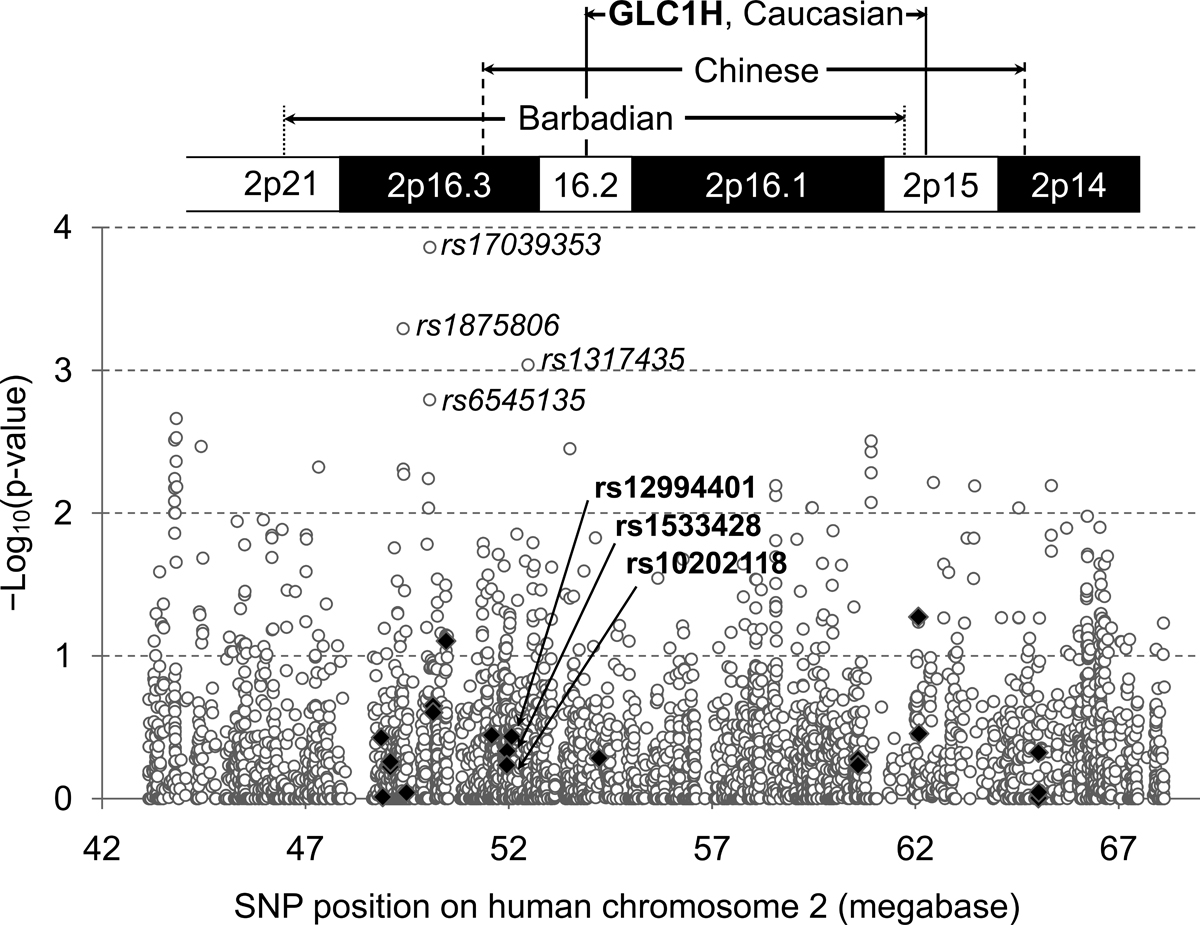
 Figure 1 of
Kim, Mol Vis 2011; 17:1136-1143.
Figure 1 of
Kim, Mol Vis 2011; 17:1136-1143.