Figure 5. Graphs presenting electroretinographic measurements of animals at age P180. Electroretinographic (ERG) measurements obtained
with P180 (six-month-old) mice of the Rosa26 (wt), Rosa26-floxSTOP/SRF-VP16 (het), and Rosa26-floxSTOP/SRF-VP16 (hom) genotypes. A: Typical waveforms are shown of scotopic and photopic ERGs, scotopic and oscillatory potentials, as well as the photopic
30 Hz flicker, as indicated. Note the different scaling. B: Values of amplitudes of scotopic a-waves and b-waves depending on the intensity of light stimuli are shown. Amplitudes measured
in wild-type mice are larger than amplitudes obtained in the mutants, with high significance over almost all light intensities
(***p<0.001).
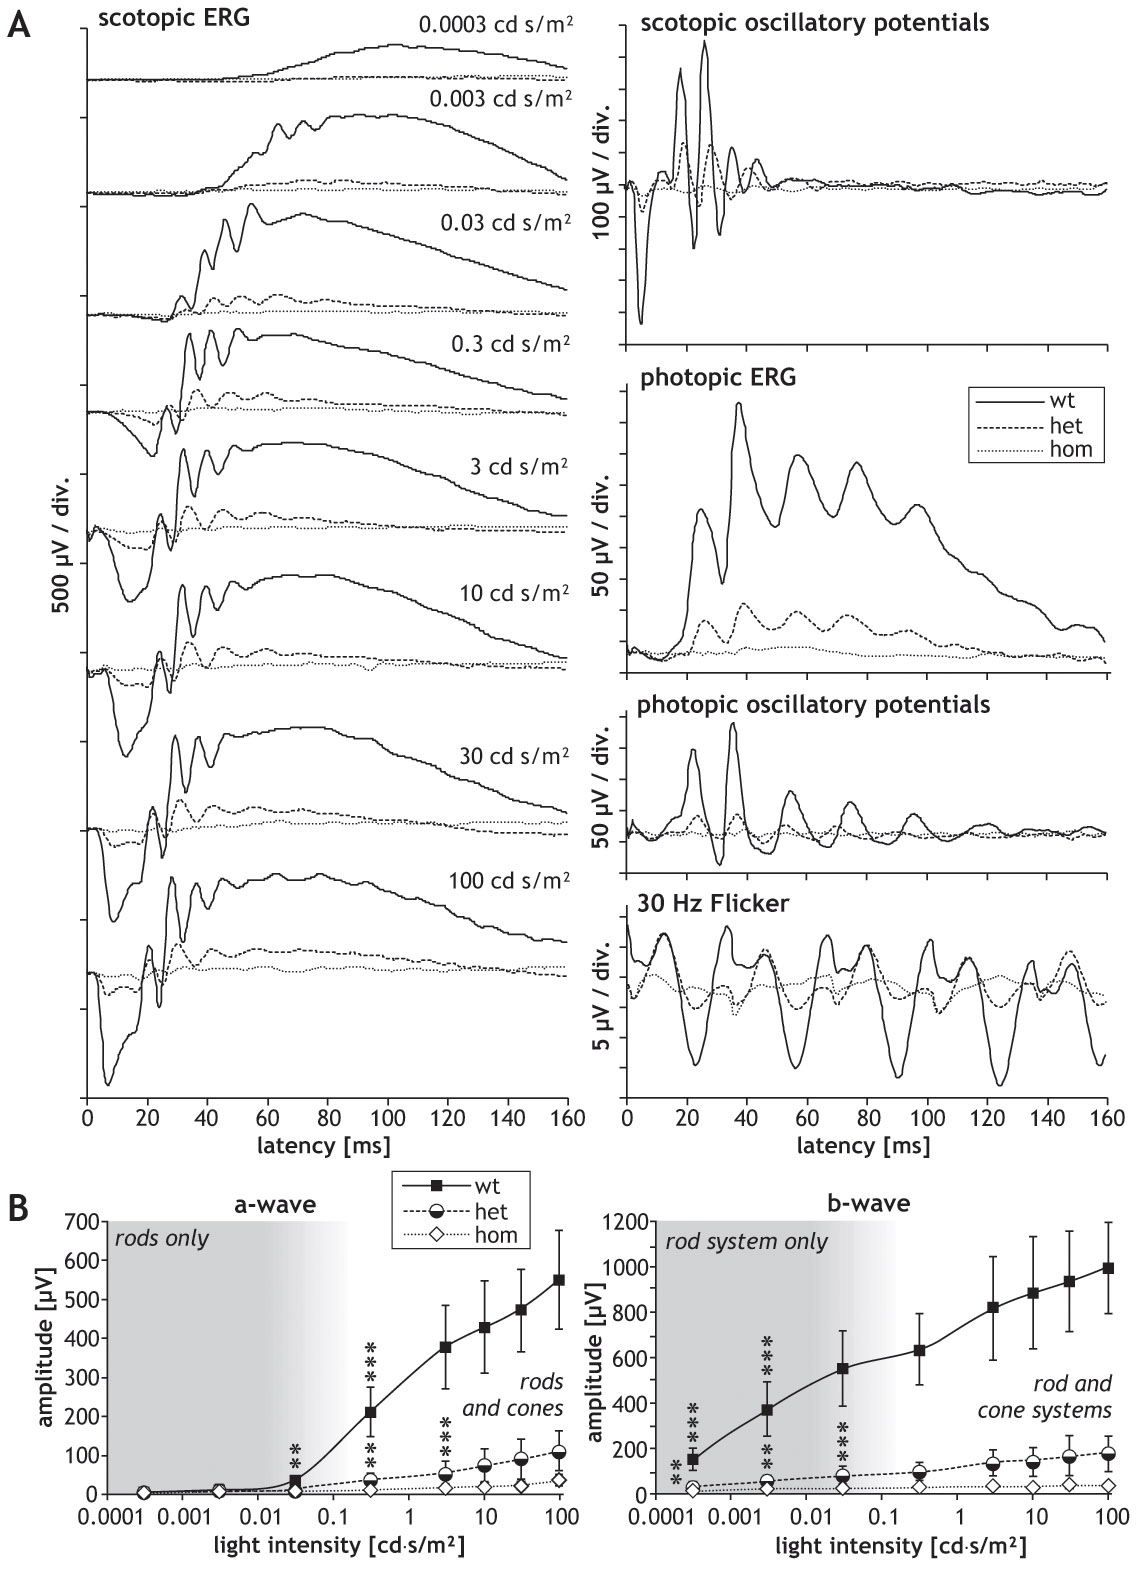
 Figure 5 of
Sandström, Mol Vis 2011; 17:1110-1127.
Figure 5 of
Sandström, Mol Vis 2011; 17:1110-1127.