Figure 4. Quantification of electroretinographic parameters. Comparison of several electroretinographic (ERG) parameters obtained in
P30 and P180 Rosa26 wild-type (wt), Rosa26-floxSTOP/SRF-VP16 (het), and Rosa26-floxSTOP/SRF-VP16 (hom) mice, respectively, as indicated. A: Scotopic- (left) and photopic (right) oscillatory index. B: Photopic b-wave (left) and photopic 30Hz flicker (right). C: b/a ratio. D: OP/b ratio. Significances of differences between wild-type and transgenic mice are indicated by asterisks, and significances
of the differences between heterozygous and homozygous mice are indicated by crosses (* or †p<0.05, ** or ††p<0.01, ***p<0.001).
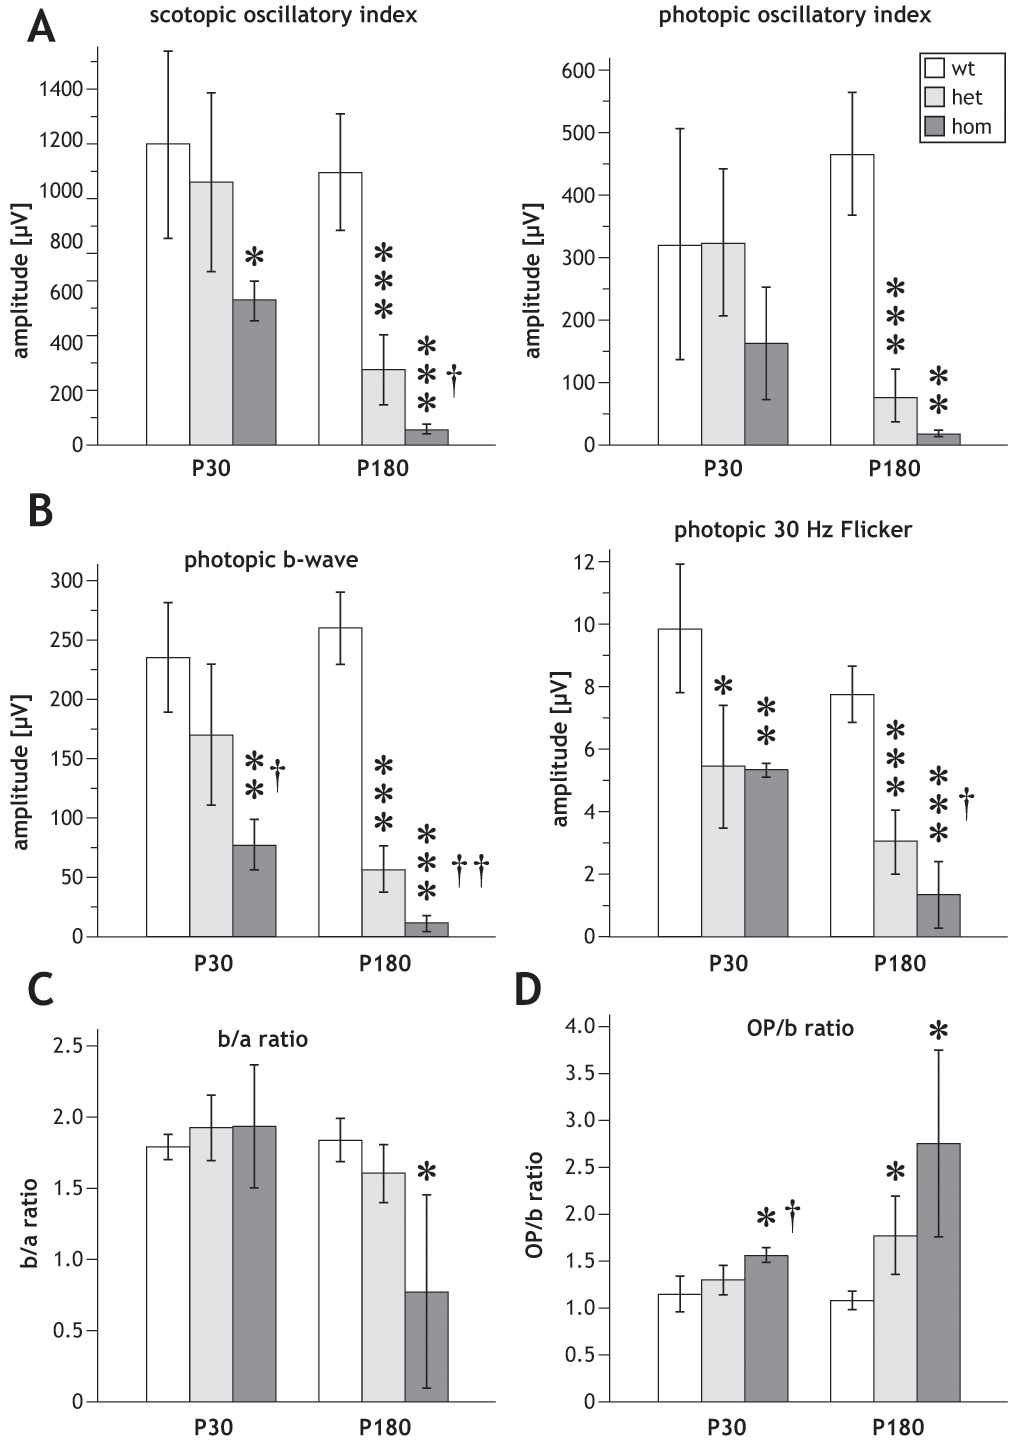
 Figure 4 of
Sandström, Mol Vis 2011; 17:1110-1127.
Figure 4 of
Sandström, Mol Vis 2011; 17:1110-1127.