Figure 3. Graphs presenting electroretinographic measurements of animals at age P30. Electoretinographic (ERG) waveforms obtained in
P30 (one-month-old) mice of the Rosa26 (wt), Rosa26-floxSTOP/SRF-VP16 (het), and Rosa26-floxSTOP/SRF-VP16 (hom) genotypes. A: Typical waveforms are shown of scotopic and photopic ERGs, scotopic and oscillatory potentials, as well as the photopic
30 Hz flicker, as indicated. Note the different scaling. B: Values of amplitudes of scotopic a-waves and b-waves, depending on the intensity of light stimuli. Significances of differences
between wild-type and homozygous mice are indicated by asterisks, and significances of the differences between heterozygous
and homozygous mice is indicated by crosses (* or †p<0.05, ** or ††p<0.01, ***p<0.001).
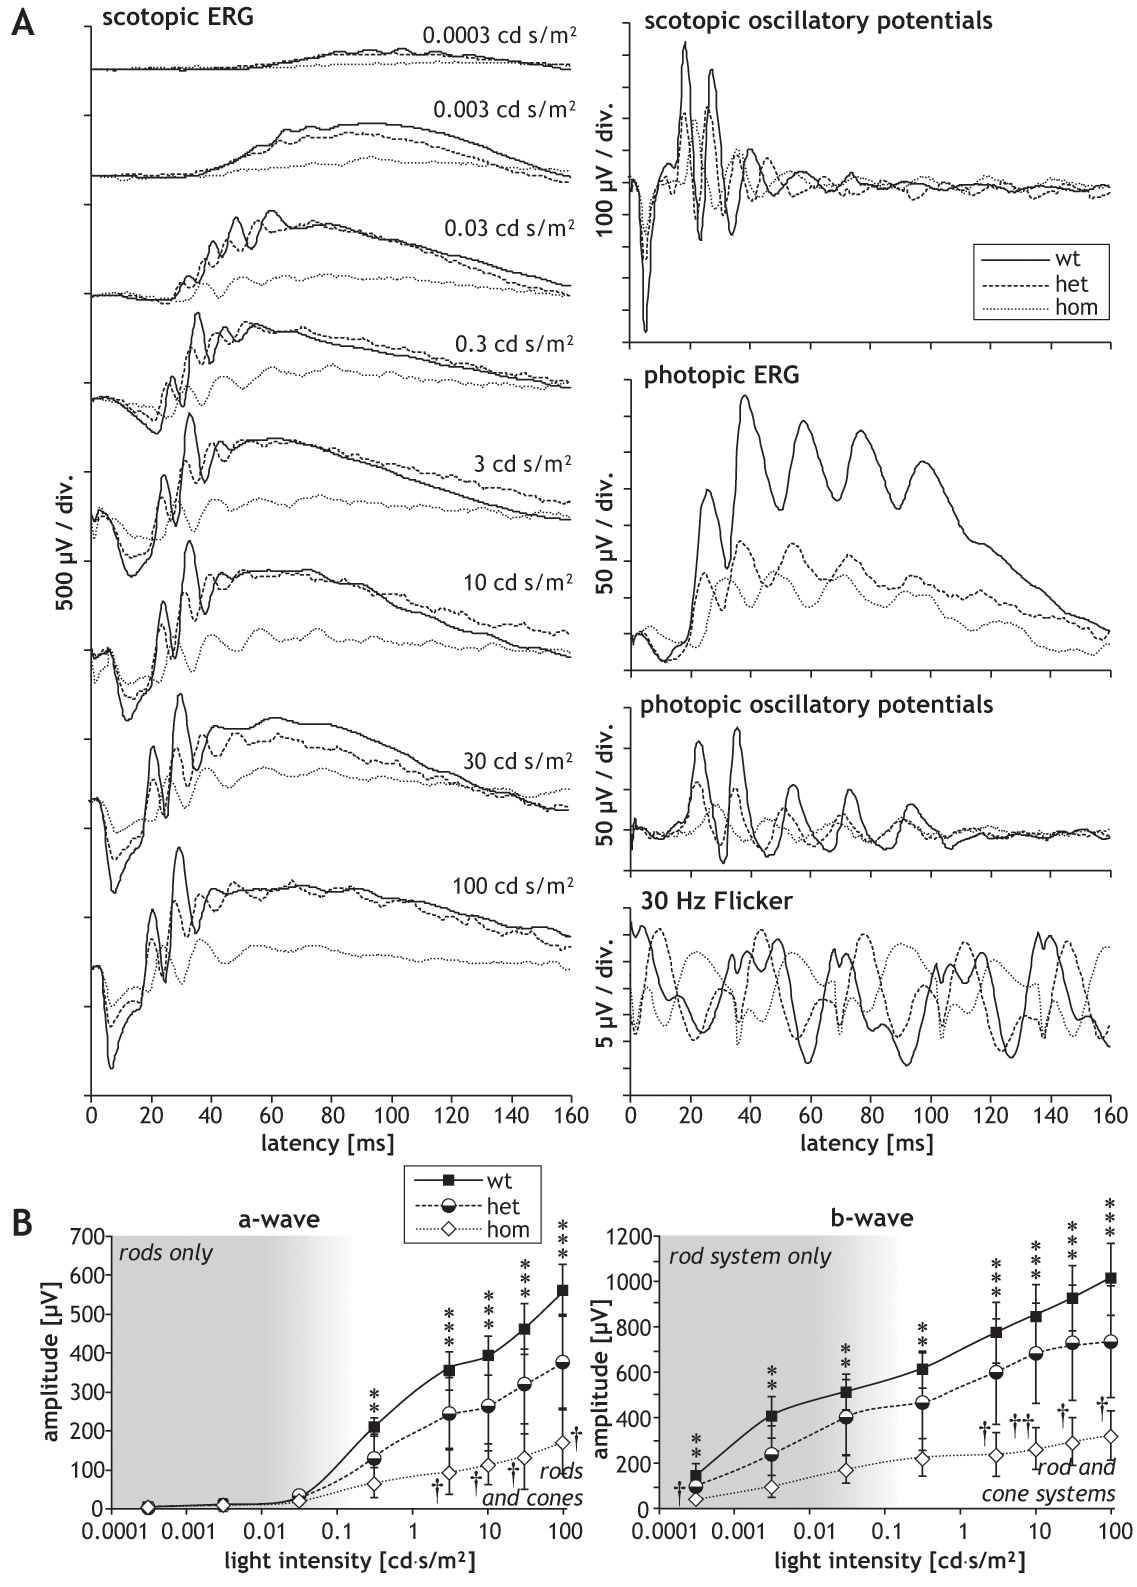
 Figure 3 of
Sandström, Mol Vis 2011; 17:1110-1127.
Figure 3 of
Sandström, Mol Vis 2011; 17:1110-1127.