Figure 5. Transduction efficiency of
unmodified scAAV1, scAAV8, and their respective single Y-F capsid
mutant vectors. Transduction efficiency of scAAV1 and scAAV1 Y731F (A),
scAAV8,
scAAV8 Y733F, and scAAV8 Y447F (B) in ARPE19 and 661W
cells measured by mCherry-mediated and fluorescence-activated cell
sorting (FACS) analysis. Data represents infections at a multiplicity
of infection (MOI) of 10,000. mCherry expression is shown in arbitrary
units calculated by multiplying the percentage of positive cells by the
mean fluorescence intensity in each sample. Each value represents the
average of three samples (eight pooled wells of a 24-well
plate/sample), based on 10,000 counted cells.
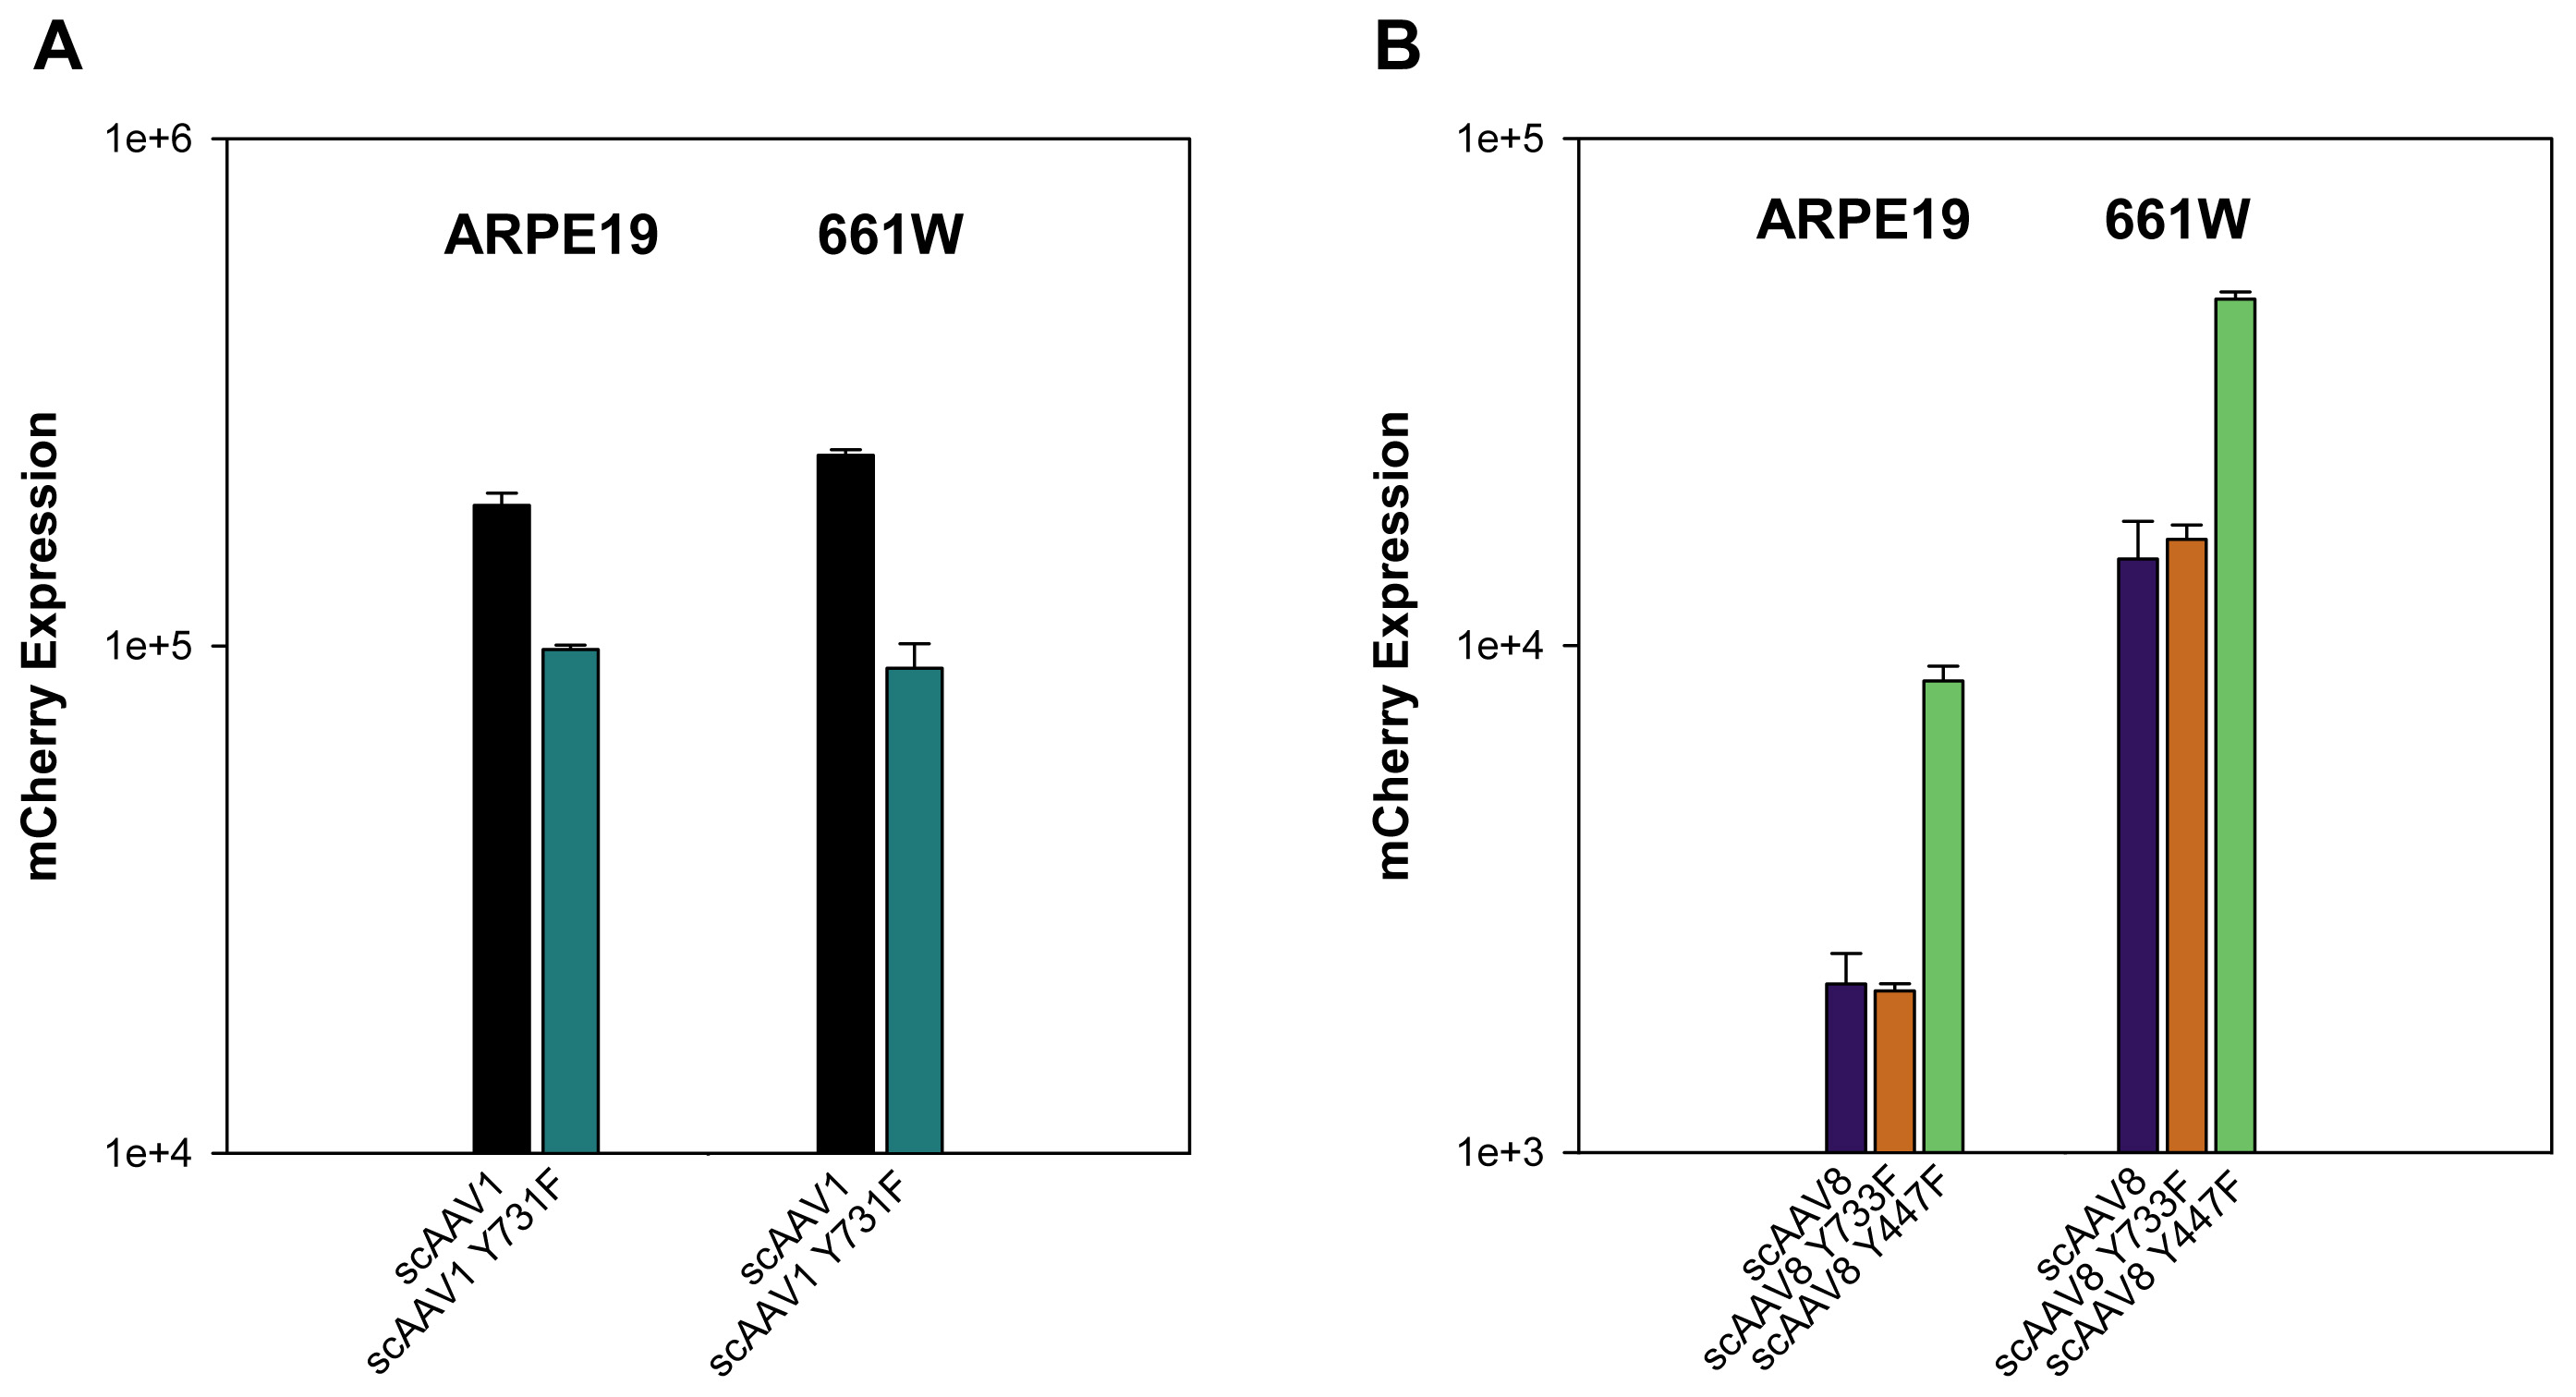
 Figure 5 of Ryals, Mol Vis 2011; 17:1090-1102.