Figure 1. Fluorescent PCR amplification.
Capillary electrophoresis showing fluorescent PCR amplification of (A)
the OPA1 gene (140 bp; blue peak) and (B) the HBB gene (175 bp) for a
POAG patient. Similarly, (C) shows OPA1 amplification and (D) shows HBB
amplification for a control individual. The x-axis represents peak size
in base pairs (bp) and the y-axis the signal intensity. The area under
the peak (not shown here) corresponds to gene expression levels and was
measured by the GeneMapper software (Applied Biosystems). Sizing of the
peaks was done by running the 500 pb LIZ size-ladder (peaks in orange)
with the samples.
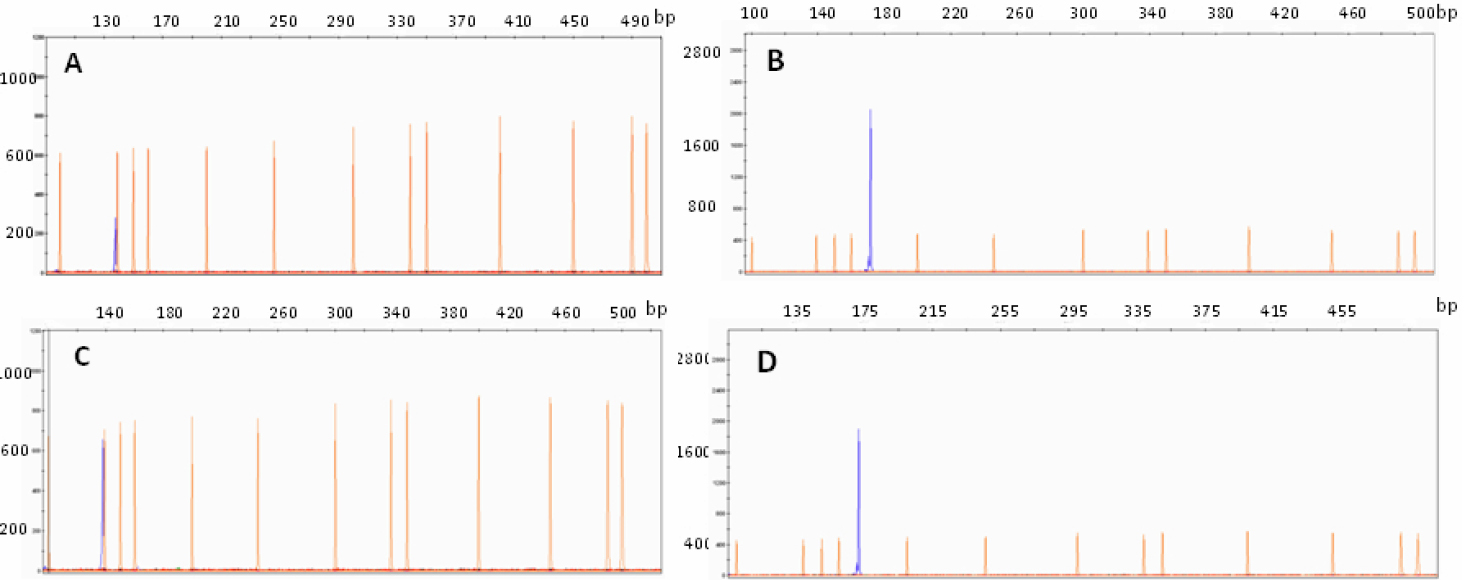
 Figure 1 of Bosley, Mol Vis 2011; 17:1074-1079.