Figure 9. The expression of apelin and vascular endothelial growth factor mRNA. A: This shows the result of reverse-transcription PCR of GAPDH, apelin and vascular endothelial growth factor (VEGF). 1–7 represent the following groups: “normal,” “1 w,” “2 w,” “24 w,”
“1 w+intravitreal bevacizumab (IVB),” “2 w+IVB,” and “24 w+IVB,” respectively. B: This shows the VEGF mRNA expression levels in the control, central retinal vein occlusion (CRVO), and IVB groups. Error bars
represent SD. In all stages for the CRVO groups, the expression of mRNA of VEGF was upregulated, compared to the normal group
(p<0.01). In the “24 w” group, the expression of VEGF mRNA was lower than in the “1 w” and “2 w” groups, but still higher
than normal (p<0.01). After IVB, VEGF mRNA of all the three CRVO groups decreased significantly (all p<0.01); however, the
VEGF mRNA level did not vary significantly between “1w+IVB” group, “2w+IVB” group and “24w+IVB” group and normal control (p=0.71,
0.12, and 0.24, respectively). C: Apelin mRNA expression levels in the control, CRVO, and IVB groups. Error bars represent SD. The expression of apelin mRNA
in the CRVO groups was significantly higher than normal (p<0.01). After IVB, apelin mRNA of all the three CRVO groups decreased
significantly (all p<0.01); the apelin mRNA level of “1w+IVB” group, “2w+IVB” group and “24w+IVB” were still significantly
higher than normal control (all p<0.01).
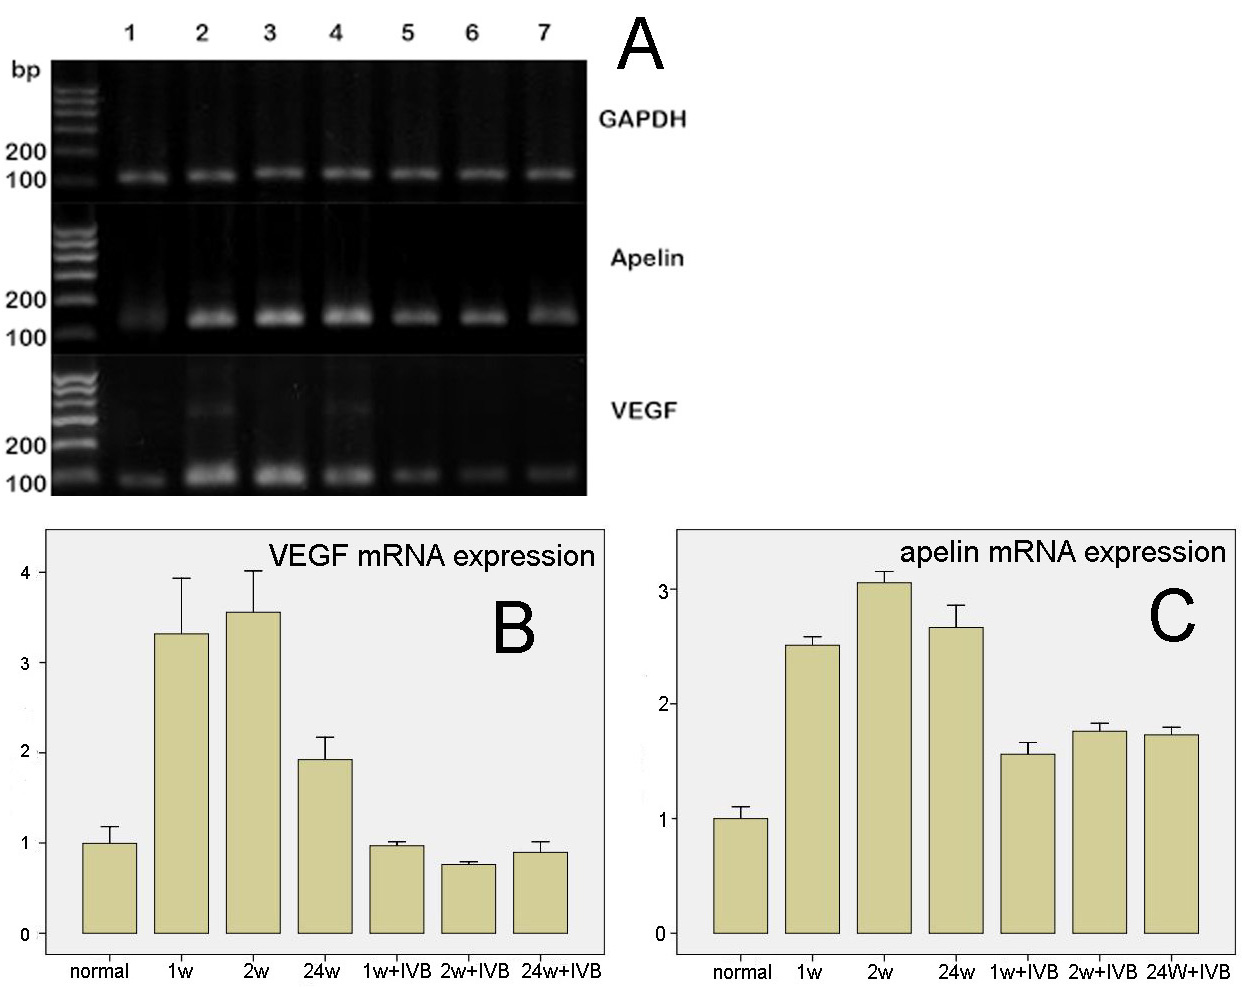
 Figure 9 of
Zhao, Mol Vis 2011; 17:1044-1055.
Figure 9 of
Zhao, Mol Vis 2011; 17:1044-1055.