Figure 2. Occurence of immune reactions
separated by the median of the cytokine score. Kaplan–Meier survival
analysis showing an almost 100% separation accuracy between patients
with and without immune reactions following PK by the median (−4.97) of
the calculated cytokine score (A, n=9 for each group). This
differentiation is independent from the patients’ risk profile (B,
definition
for
high
risk situations see section patients and methods).
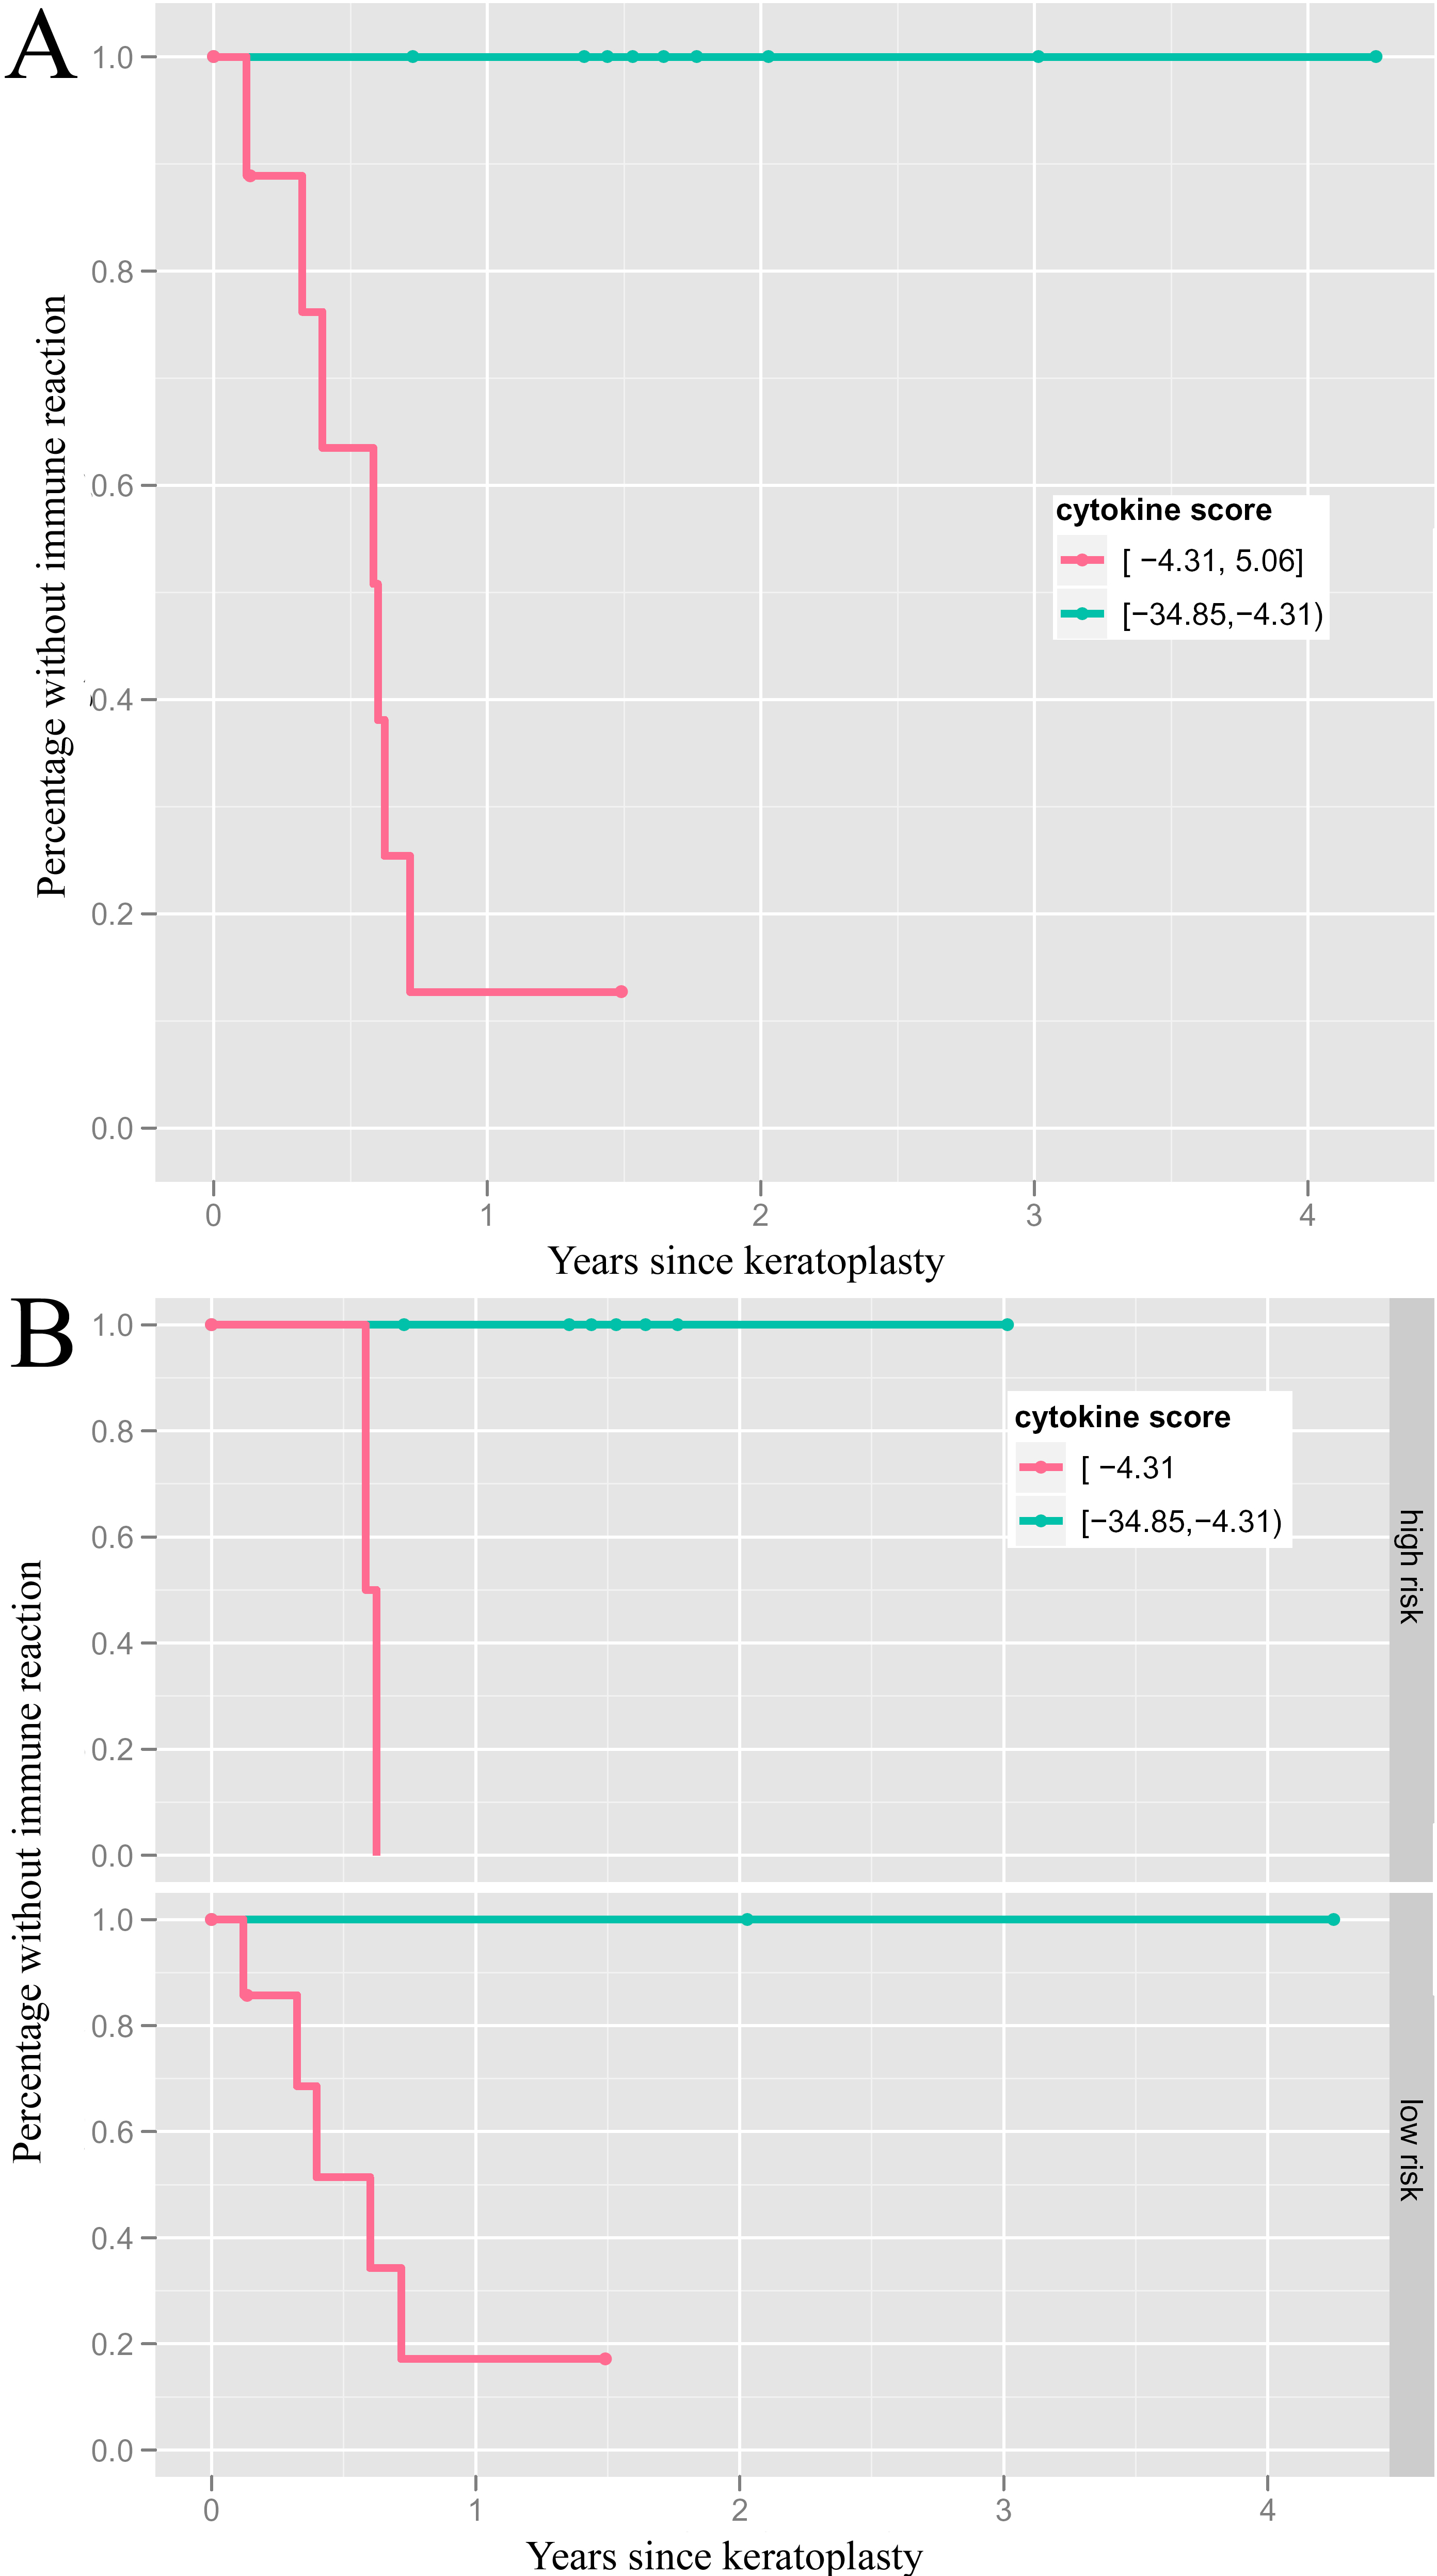
 Figure 2 of Maier, Mol Vis 2011; 17:1016-1023.