Figure 1. Backward selection. As IL10 showed the least significant result (p=0.78) in the first analysis (A), it was excluded from the second analysis. In the second analysis (B), TNF-α showed the least significant result (p=0.80), and was excluded from the third analysis (C). As the level of significance for backward selection was chosen to be p<0.1, all factors included in analysis three (age,
IL2, IL4, IL5, and IFN-γ) were included in the final Kaplan–Meier survival analysis.
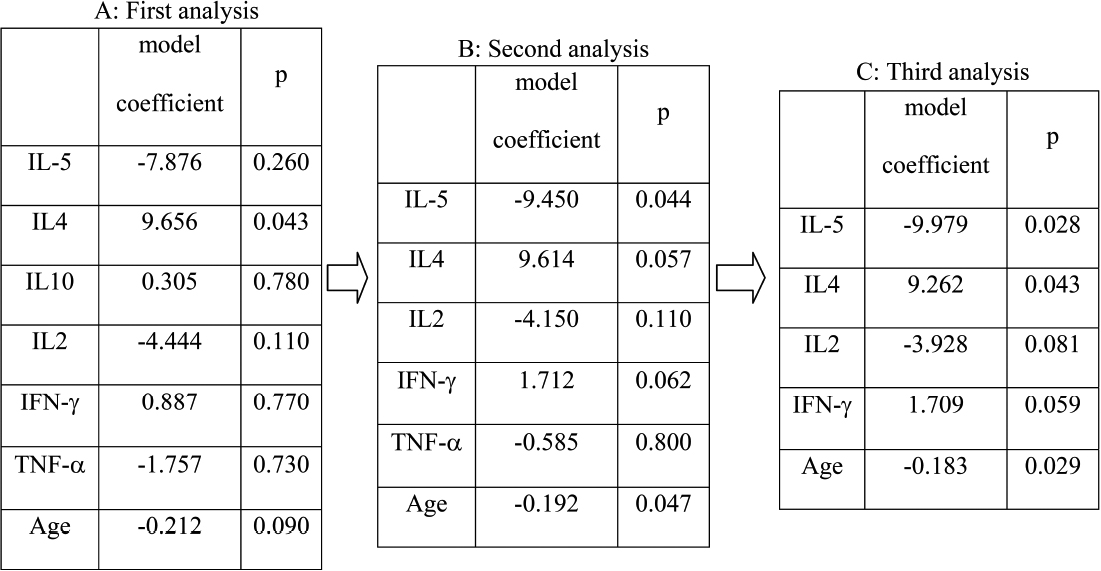
 Figure 1 of
Maier, Mol Vis 2011; 17:1016-1023.
Figure 1 of
Maier, Mol Vis 2011; 17:1016-1023.