Figure 4. Overexpression of P58IPK
suppressed the expression of CHOP, TNF-α, and VEGF in cultured RRCECs. A:
mRNA
levels of CHOP, TNF-α, and VEGF were determined by real-time PCR,
in GFP/dia group, GFP/no-dia group, P58IPK/dia group, and P58IPK/no-dia
group.
The expression level of CHOP in each groups were 0.64 ±0.03,
0.31±0.02, 0.28±0.01 and 0.34±0.05;respectively, (p<0.05, n=6), The
expression level of TNF-α in each groups were 0.81±0.10, 0.44± 0.06,
0.39±0.03, and 0.43±0.02 respectively, (p<0.05, n=6), The expression
level of VEGF in each groups were 0.22±0.01, 0.12±0.01, 0.09±0.01, and
0.10±0.01 respectively, (p<0.05, n=6), B: A representative
western blot result is shown in B. C: The amount of
protein expression was quantified relative to the level of β-actin.
Results are representative of six experiments. Results are expressed as
mean±standard deviation; The protein level of CHOP in each groups were
1.14 ±0.12, 0.73±0.06, 0.58±0.04, and 0.53±0.05; respectively,
(p<0.05, n=6), The protein level of TNF-α in each groups were
1.41±0.13, 0.81±0.07, 0.79±0.05, and 0.73±0.06 respectively,
(p<0.05, n=6), The protein level of VEGF in each groups were
0.32±0.02, 0.08±0.01, 0.07±0.01 and 0.11±0.01 respectively, (p<0.05,
n=6).
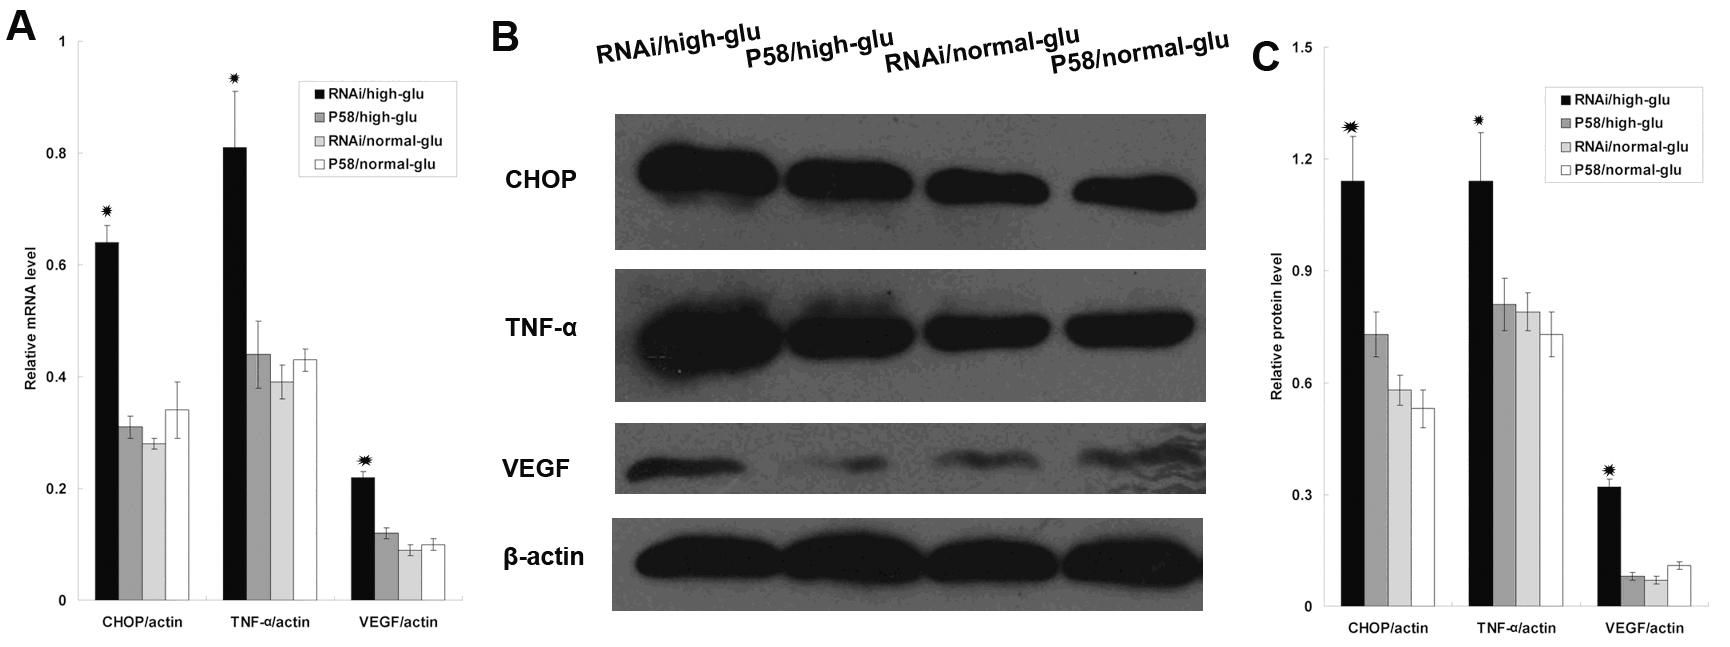
 Figure 4 of Yang, Mol Vis 2011; 17:78-84.