Figure 3. The expression of P58IPK
in cultured RRCECs in group A (pGIPZ-P58IPK RNAi), group B
(control group), group C (irrelevant siRNA), and group D (rAAV2-P58IPK).
A: mRNA levels of P58IPK were determined by real-time
PCR analysis. The expression level of P58IPK in either
groups were 0.16±0.02, 0.27±0.03, 0.30±0.03, 0.84±0.06 respectively,
There was a significant difference that Group B compared with group A
and group D, (p<0.05; n=6). There was not a significant difference
that Group B compared with group C, (p>0.05; n=6). B: A
representative western blot result. C: The amount of protein
expression was quantified relative to the level of β-actin. Results are
representative of six experiments. Results are expressed as
mean±standard deviation; The protein level of P58IPK in
either groups were 0.37±0.04, 0.65±0.06, 0.71±0.06, 1.07±0.08
respectively, There was a significant difference that Group B compared
with group A and group D, (p<0.05; n=6), There was not a significant
difference that Group B compared with group C, (p>0.05; n=6).
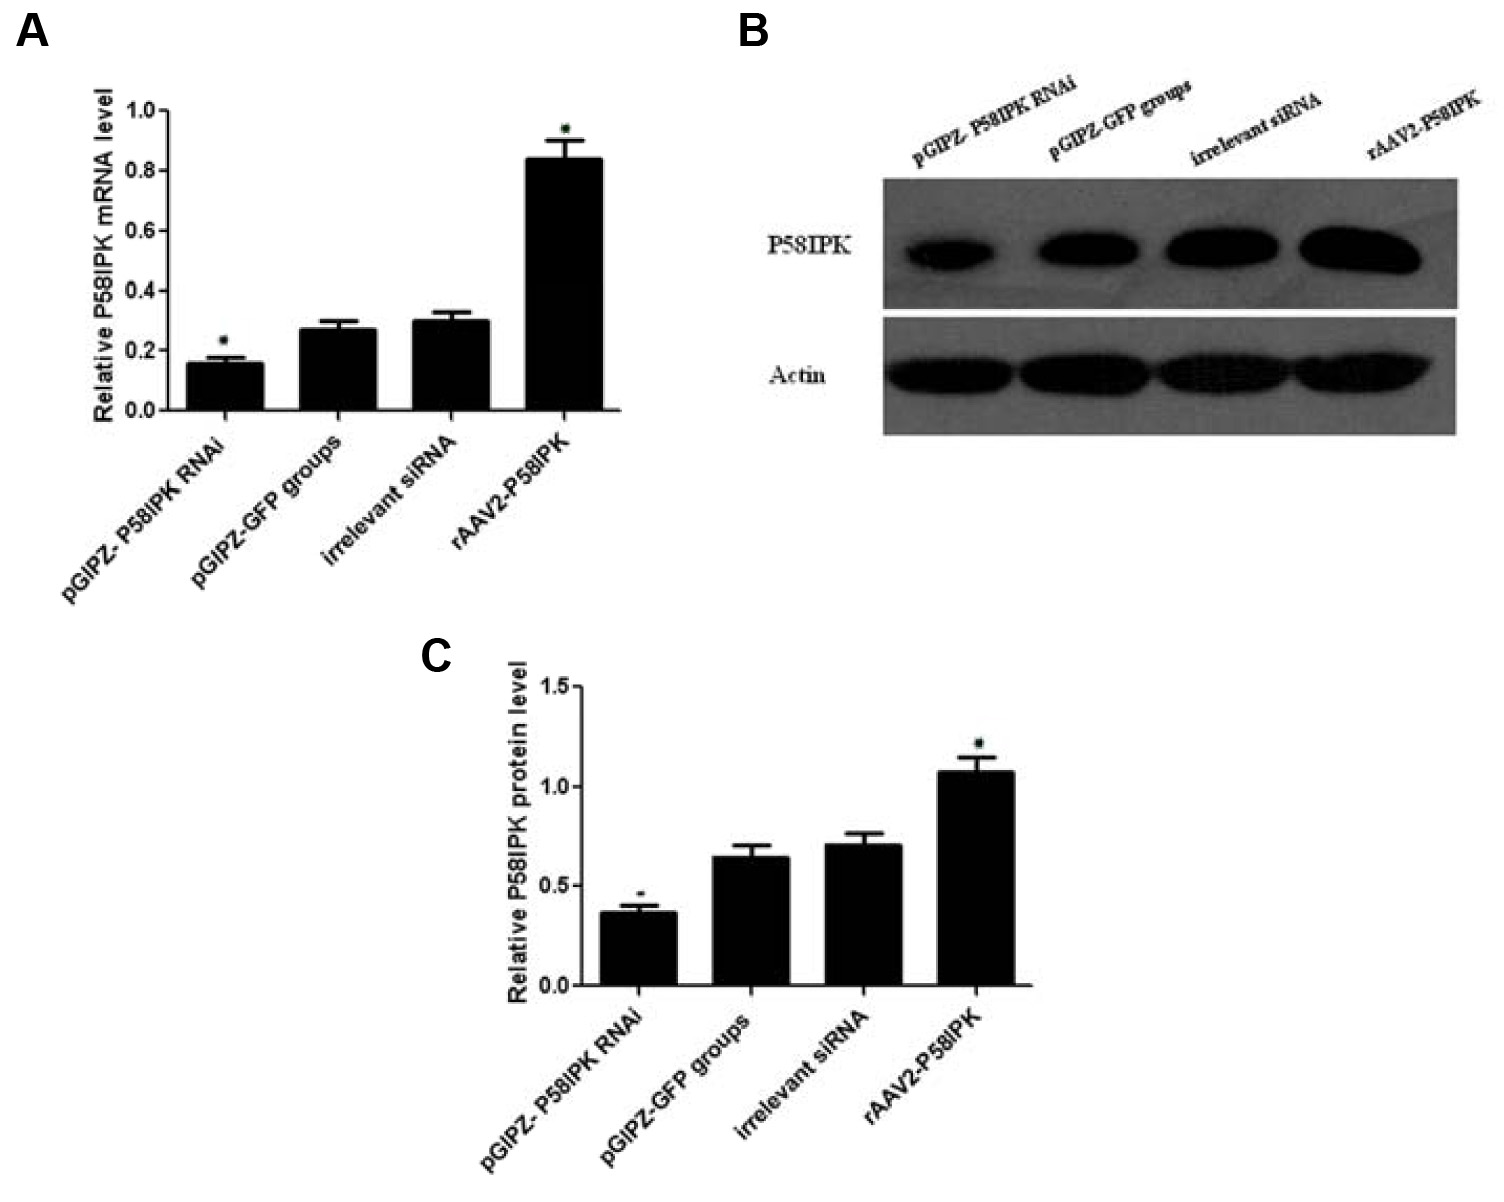
 Figure 3 of Yang, Mol Vis 2011; 17:78-84.