Figure 2. Overexpression of P58IPK
suppressed the expression of Core/emopamil binding protein homologous
protein (CHOP), tumor necrosis factor (TNF)-α and vascular endothelial
growth factor (VEGF) in the retina of diabetic rats. A: mRNA
levels of P58IPK, CHOP, TNF-α, and VEGF were determined by
real-time PCR, in GFP/dia group, GFP/no-dia group, P58IPK/dia
group,
and P58IPK/no-dia group, The expression level of P58IPK
in each groups were 0.27±0.02, 0.33±0.05, 0.64±0.04, and 0.58±0.04
(p<0.05, n=6), The expression level of CHOP in each groups were
0.51±0.03, 0.28±0.02, 0.36±0.05, and 0.40±0.05; respectively,
(p<0.05, n=6), The expression level of TNF-α in each groups were
0.44±0.02, 0.19±0.02, 0.26±0.03, and 0.32±0.03 respectively,
(p<0.05, n=6), The expression level of VEGF in each groups were
0.86±0.13, 0.27±0.02, 0.37±0.05, and 0.29±0.03 respectively,
(p<0.05, n=6), B: A representative western blot result is
shown in B. C: The amount of protein expression was
quantified relative to the level of β-actin. Results are representative
of six experiments. Results are expressed as mean±standard deviation;
The protein level of P58IPK in each groups were 0.28± 0.02,
0.25±0.04, 0.47±0.064, and 0.52±0.06 (p<0.05, n=6), The protein
level of CHOP in each groups were 0.36 ±0.04, 0.18±0.02, 0.21±0.03, and
0.24±0.03;respectively, (p<0.05, n=6), The protein level of TNF-α in
each groups were 0.40±0.03, 0.21±0.02, 0.26±0.04, and 0.22±0.03
respectively, (p<0.05, n=6), The protein level of VEGF in each
groups were 0.22±0.01, 0.08±0.01, 0.13±0.01, and 0.10±0.01
respectively, (p<0.05, n=6).
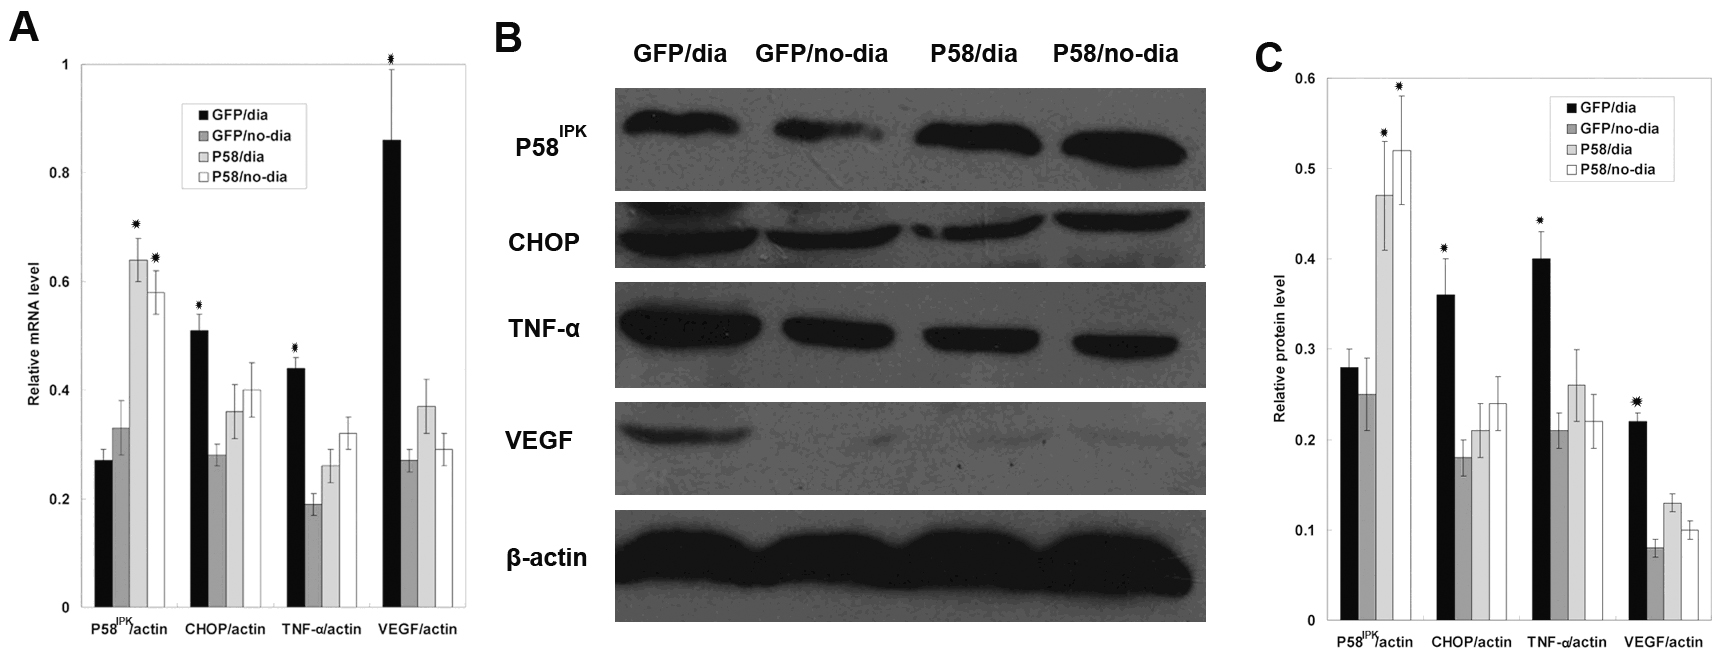
 Figure 2 of Yang, Mol Vis 2011; 17:78-84.