Figure 1. Measurement of blood–retinal barrier breakdown by Evans blue. A: Representative microphotographs from groups GFP/dia, GFP/no-dia, P58/dia, and P58/no-dia. Scale bar equal to 100 μm for
A-D. B: The areas of blood vessel leakage were quantified and presented as mean±standard deviation; 15.8±1.8% in the GFP/dia group
(n=6); 3.6±0.9% in the GFP/no-dia group (n=6); 6.6±1.2% in the P58IPK/dia group (n=6); and 3.4±1.2% in the P58/no-dia group (n=6; p<0.05, GFP/dia group versus P58/dia group); * There was a significant
difference that GFP/dia Group compared with GFP/no-dia group, P58/dia group and P58/no-dia group (p<0.05; n=6). C: EB contents in the rat retina were evaluated as described in Methods. EB contents in the retina obtained from rAAV2-P58IPK-infected rats were lower compared with the GFP/dia group: 38.3±3.3 ng/mg in the GFP/dia group; 14.1±1.5 ng/mg in the GFP/no-dia
group; 20.5±1.5 ng/mg in the P58/dia group; and 13.3±1.8 ng/mg in the P58IPK/non-dia group (p<0.05, GFP/dia group versus P58IPK/dia group),* There was a significant difference that GFP/dia Group compared with GFP/no-dia group, P58/dia group and P58/no-dia
group (p<0.05; n=6).
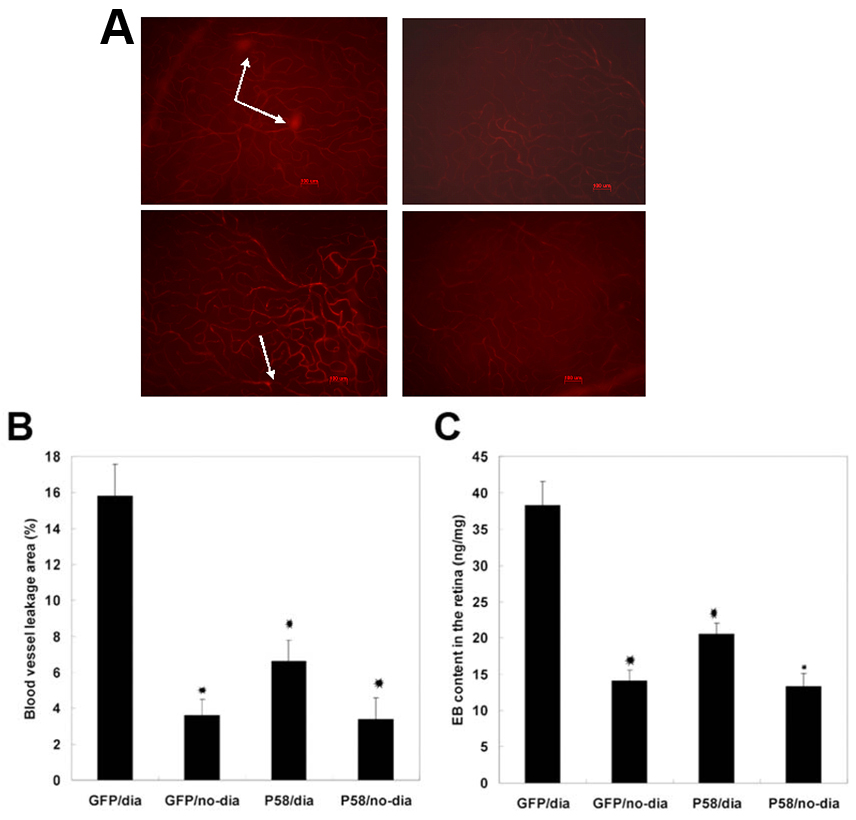
 Figure 1 of
Yang, Mol Vis 2011; 17:78-84.
Figure 1 of
Yang, Mol Vis 2011; 17:78-84.