Figure 5. QPCR analysis of three crystallin genes. Two different samples were used from operated animals two weeks after surgery. For
each sample the analysis was in triplicates. Note that expression of these crystallin genes was down regulated in all cases
due to C5 antagonist treatment, as was the case in the microarray analysis. Statistics are as follows: CryaB-1: p=0.0000114343<0.05, CryaB-2: p=0.0000296783<0.05, CrybB2-1: p=0.0000598278<0.05, CrybB2-2: p=0.0002057<0.05, CryaA-1: p=0.005616049<0.05, CryaA-2: p=0.000385042<0.05.
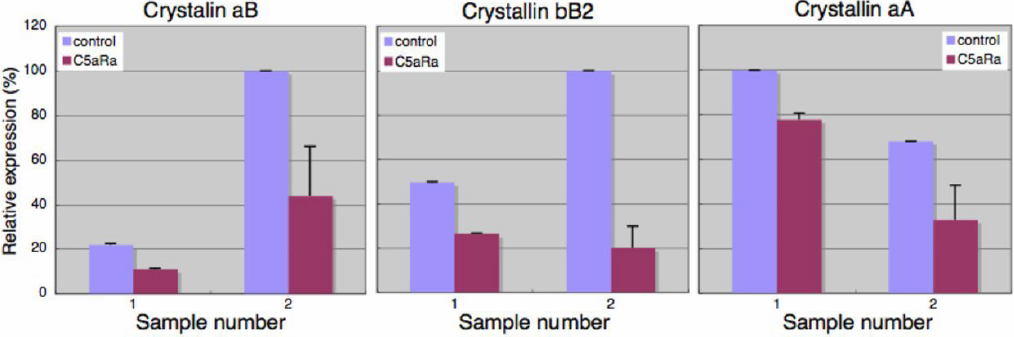
 Figure 5 of
Suetsugu-Maki, Mol Vis 2011; 17:949-964.
Figure 5 of
Suetsugu-Maki, Mol Vis 2011; 17:949-964.