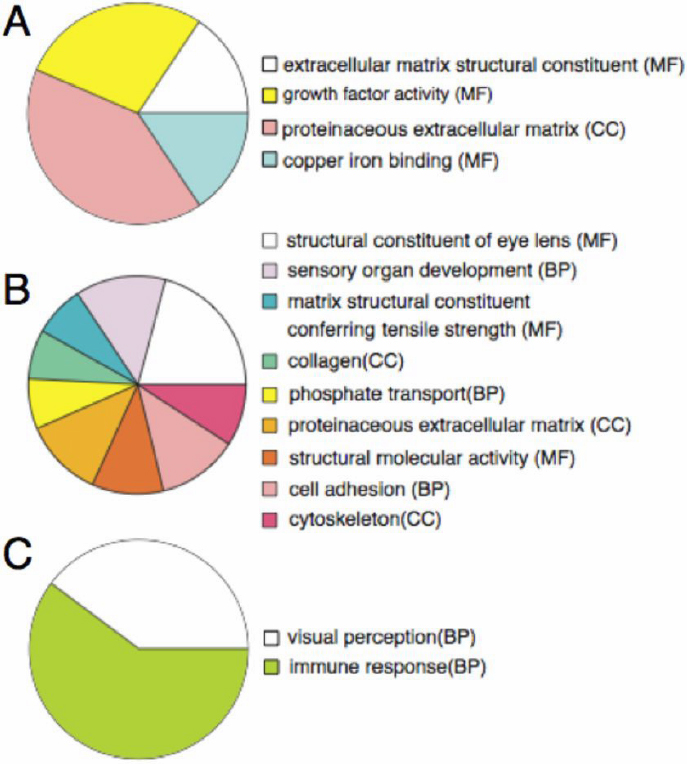
Figure 4. Microarray analysis. The complete lists are presented in
Appendix 1. For each gene the degree of down- or upregulation due to the treatment is recorded. In this Figure the pies show differentially
regulated genes grouped according to their function. Upper pie: regulated genes at week 1 after operation. Note that most
regulated genes due to the C5aR antagonist treatment are related to extracellular matrix most likely indicating active migration.
Middle pie: regulated genes at week 2 after operation. Note that the largest group is the one containing structural constituents
of eye lens, indicating regulation of crystallin genes (see also
Table 1). Lower pie: regulated genes at week 3 after operation. Only genes related to visual perception and immune response are regulated
(as being statistically enriched). CC, BP, and MF are the three domains of Gene Ontology, Cellular Component, Biologic Process,
and Molecular Function, respectively.
 Figure 4 of
Suetsugu-Maki, Mol Vis 2011; 17:949-964.
Figure 4 of
Suetsugu-Maki, Mol Vis 2011; 17:949-964.