Figure 5. Nonstationary fluctuation
analysis of glutamate currents evoked in horizontal cells by flash
photolysis of caged glutamate yielded the single-channel glutamate
receptor conductance. A: Overlay of peak-scaled glutamate
receptor membrane currents evoked in a single horizontal cell by flash
uncaging of extracellular 0.5 mM MNI-glutamate (n=16). We used a
concentration well above the Kd for AMPA receptors to
eliminate quantal variability and provide a reliable estimate of
single-channel conductance. Note the increased variance between traces
as the current decays from its peak. B: A plot of the variance
between traces and mean amplitude of glutamatergic currents. The family
of traces shown in A was binned in 5 ms intervals beginning at the peak
of the inward current. The mean amplitude and variance between traces
was calculated for each 5 ms bin. The resulting variance–mean
relationship was fit with a parabolic equation (solid line). In this
example, the single-channel current recorded at the holding potential
of −60 mV was 0.762 pA or 12.7 pS.
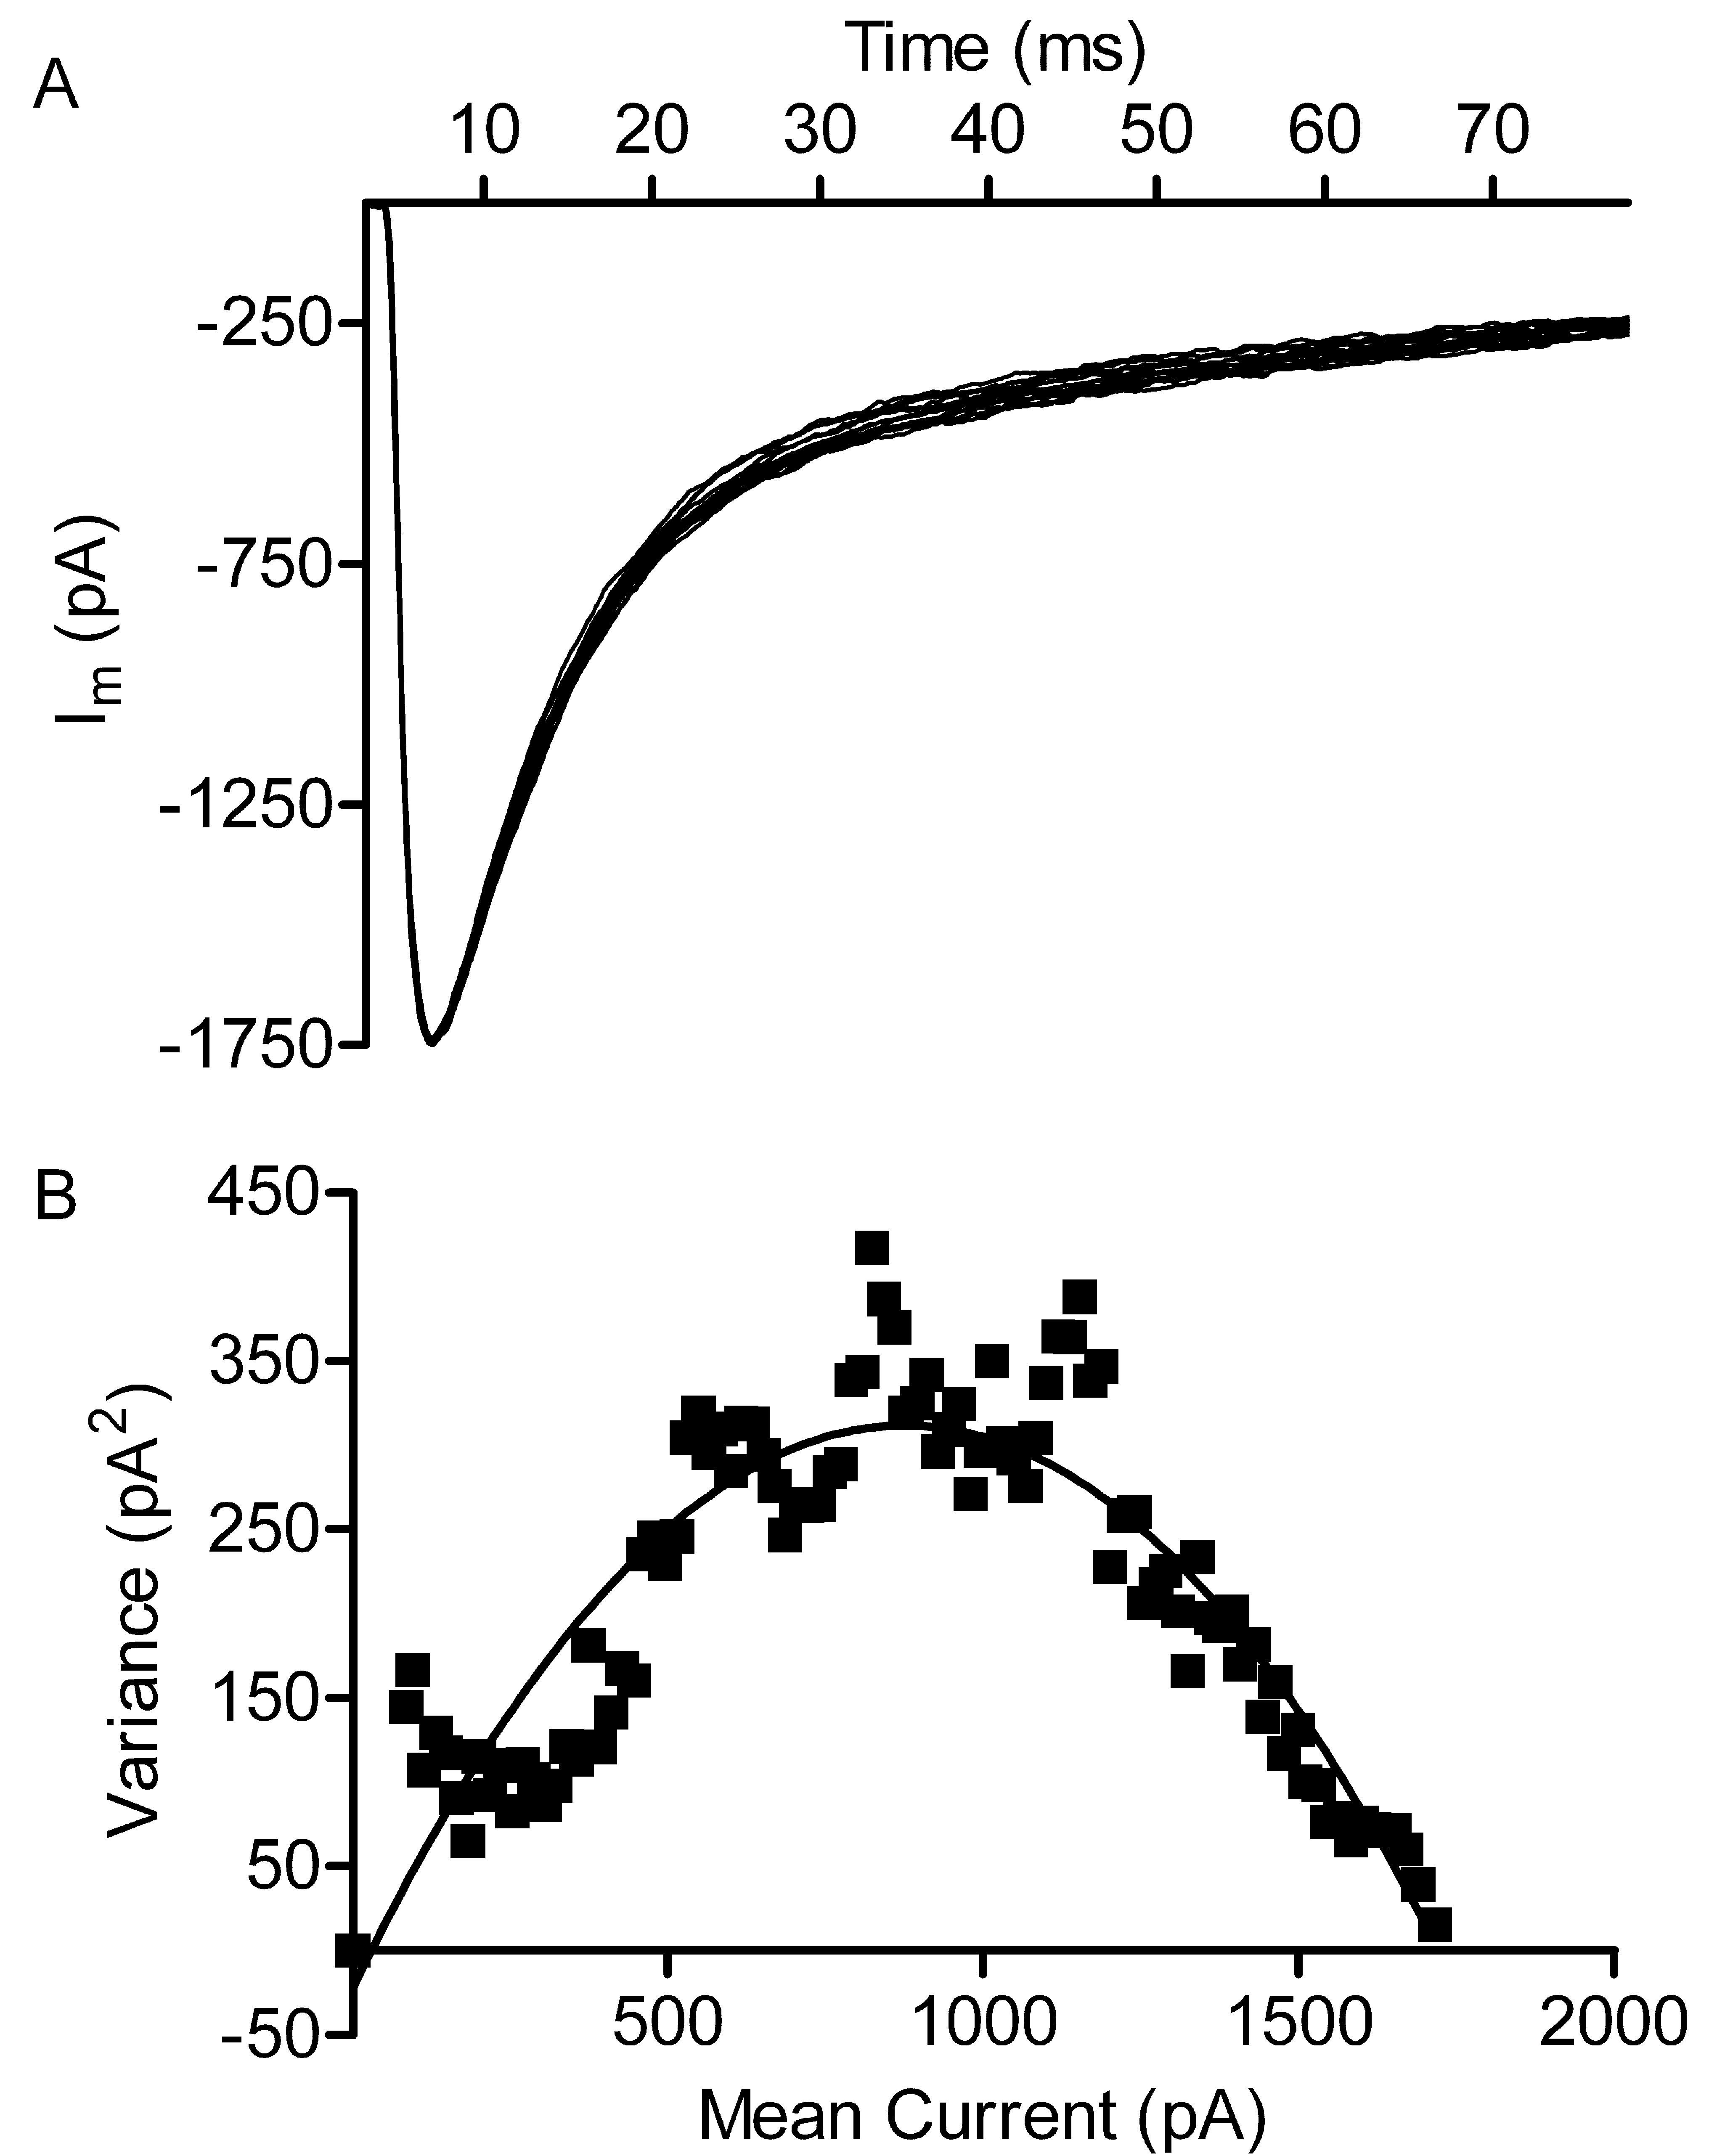
 Figure 5 of Bartoletti, Mol Vis 2011; 17:920-931.