Figure 2. The amplitude of miniature
excitatory postsynaptic currents (mEPSCs) increased after dialyzing
cones with 40 mM glutamate. A: This shows the postsynaptic
current recorded from a horizontal cell before and after depolarization
of the presynaptic cone to −30 mV. Letters above the trace identify the
short segments that are reproduced at a higher timescale in panels B
and C. B: Sample of baseline mEPSCs recorded from a
light-adapted horizontal cell before stimulation. Individual mEPSCs are
indicated by arrows. C: Sample of mEPSCs obtained while
depolarizing the presynaptic cone to −30 mV. D: Cumulative
amplitude histograms of mEPSCs recorded during baseline conditions
(solid line, n=336 events) and during a step to −30 mV (dashed line,
n=360 events) from the cell pair shown in the previous panels. In this
example, the mean amplitude increased from 7.11±0.24 pA to 7.91±0.24
pA, following application of the depolarizing step. The frequency of
mEPSCs increased from 65.7 to 72.0 Hz.
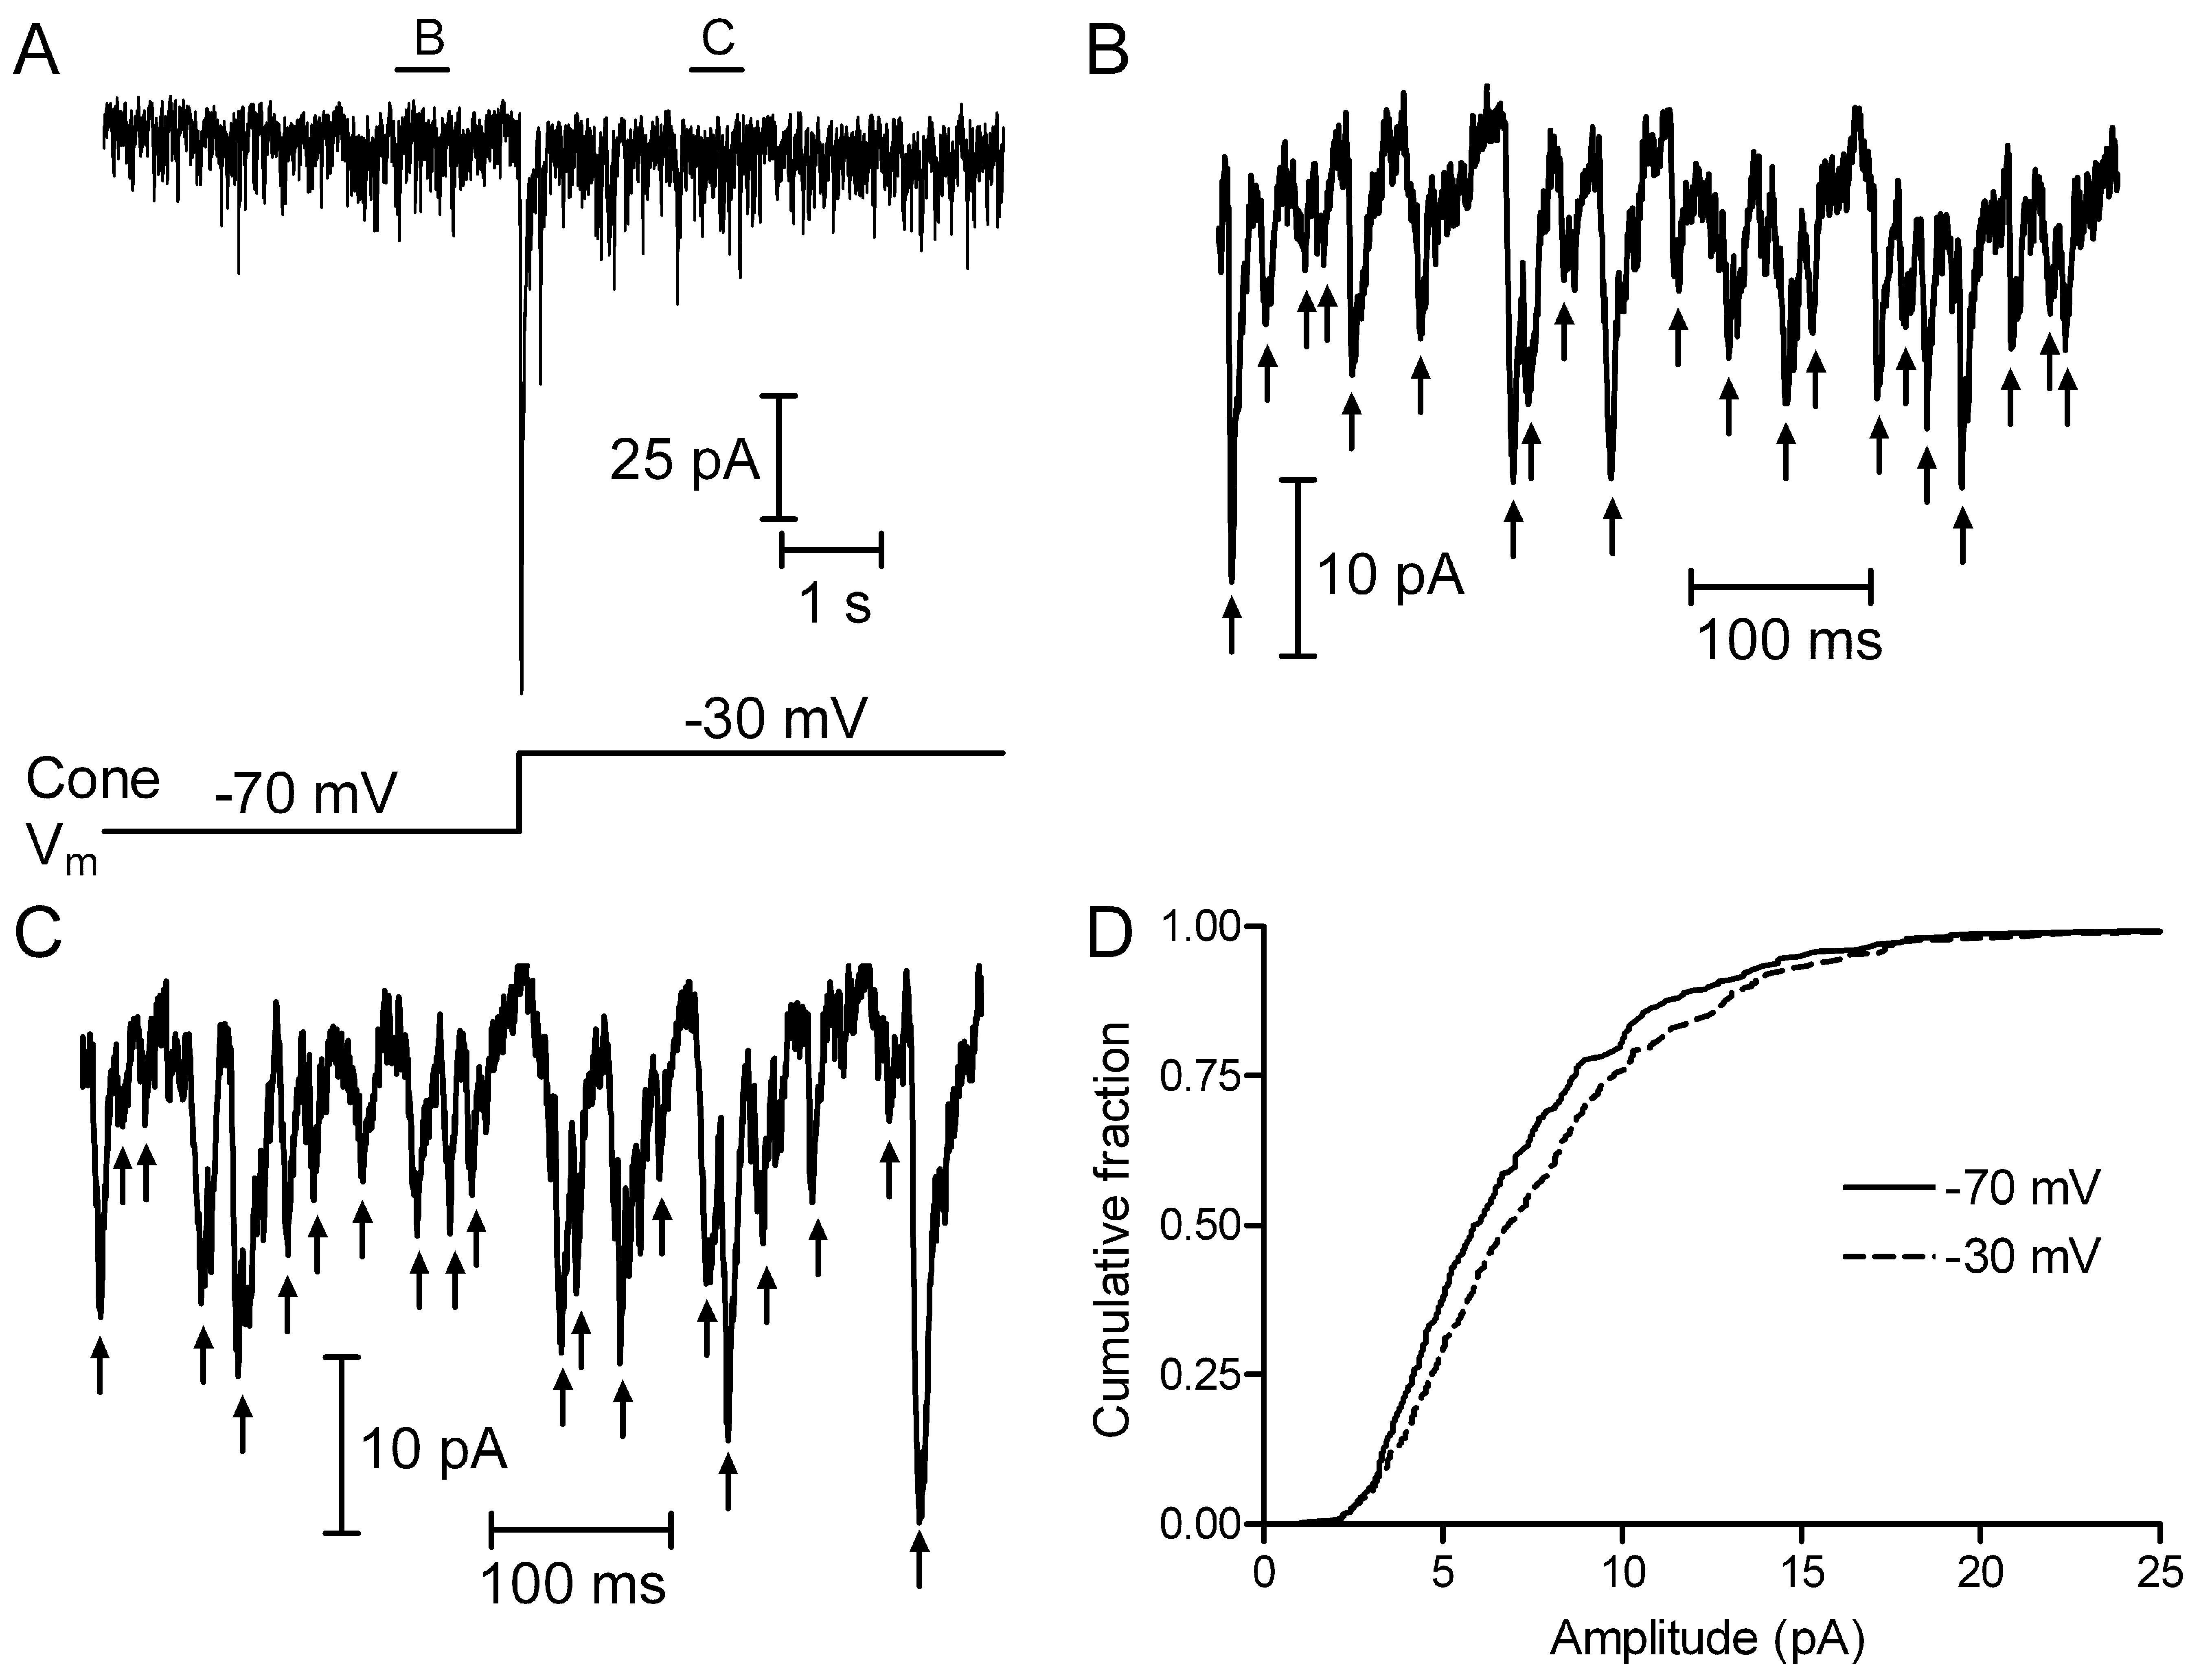
 Figure 2 of Bartoletti, Mol Vis 2011; 17:920-931.