Figure 5. Expression of all genes in the treated and control eyes normalized to the levels of the normal animals measured at 24 days
of VE. The filled circles at 3 days of recovery are the 38 VE normal mRNA values normalized to the 24 day normal values.
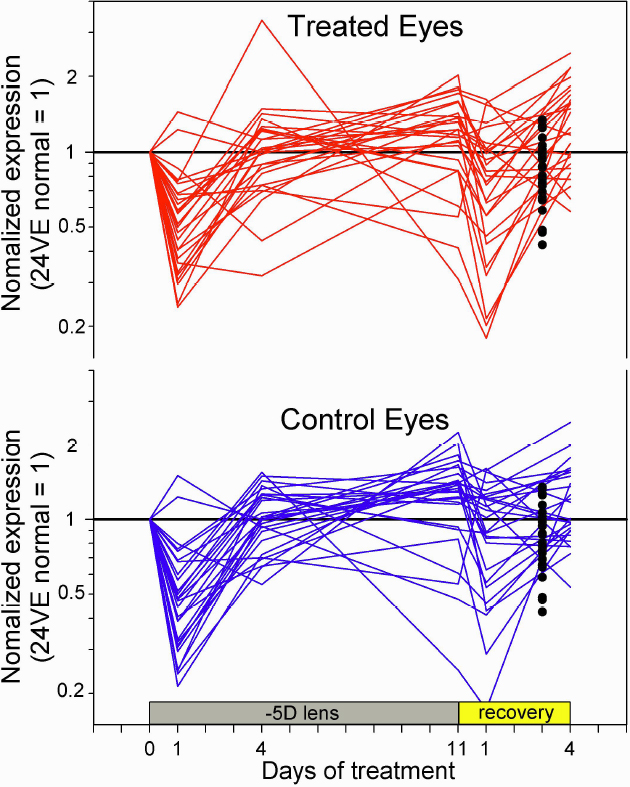
 Figure 5 of
Gao, Mol Vis 2011; 17:903-919.
Figure 5 of
Gao, Mol Vis 2011; 17:903-919.