Figure 3. The average of the SEM values of the differential gene expression for all 27 genes is shown for the 24 VE normal group (day
0) and for each of the lens-wear and recovery groups. The error bars indicate the variability (standard deviation) of the
SEM values for each group.
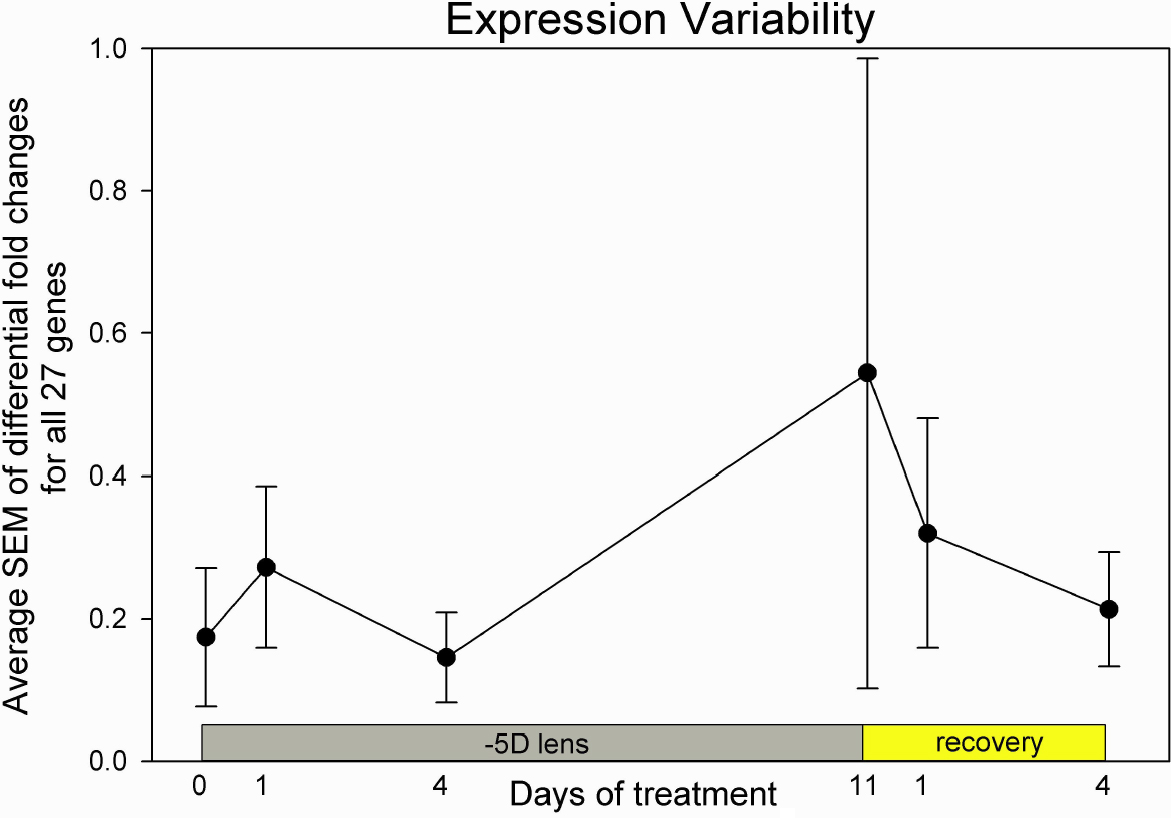
 Figure 3 of
Gao, Mol Vis 2011; 17:903-919.
Figure 3 of
Gao, Mol Vis 2011; 17:903-919.