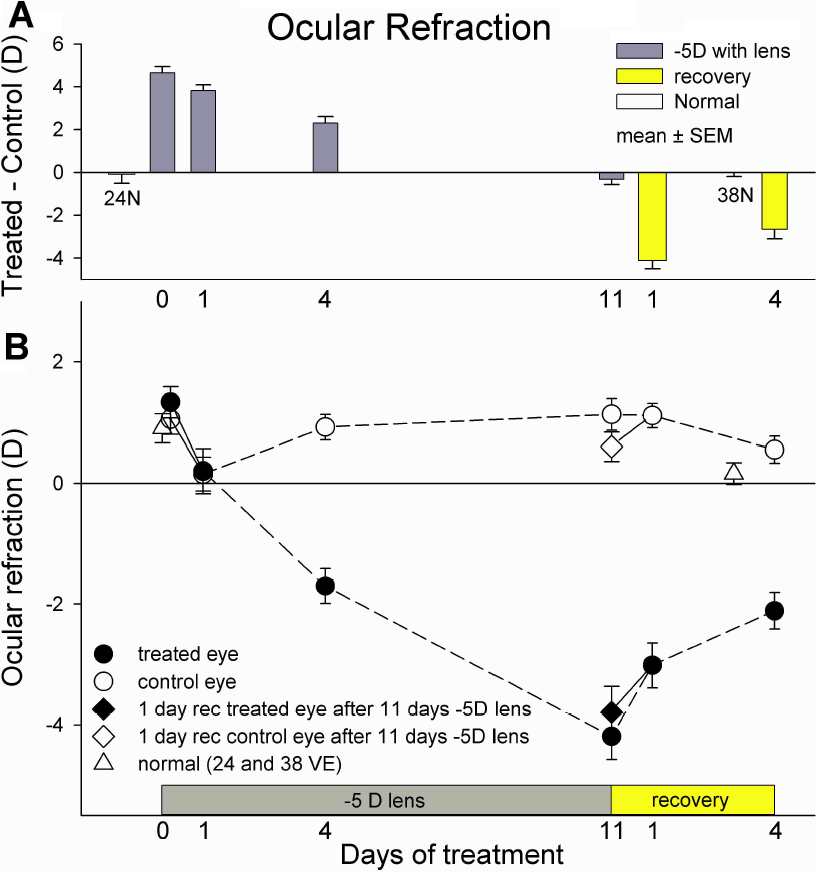
Figure 1. Refractive changes during minus lens treatment and recovery.
A: Refractive differences (treated eye – control eye). Gray bars (lens-compensation groups) indicate the refractive difference,
measured with the –5D lens in place. Yellow bars indicate the amount of myopia after 1 and 4 days of recovery. Normal eyes
showed little difference between the right and left eyes.
B: Refractive values, measured with the –5D lens removed, for the treated eyes (filled circles), control eyes (open circles)
and normal eyes (open triangles). Values are corrected for the 4 D small eye artifact [
34]. Note that the filled and open circles on day 0 (start of treatment) and day 1 are measurements from the same group of animals.
The diamond symbols at 11 days of lens wear, connected with a solid line, are the refractions of the treated and control eyes
of the 1 day recovery group measured at the end of lens wear. These are plotted to show the yoking of the control eyes with
the treated eyes at the start of lens wear and at the start of recovery. Error bars indicate standard error of the mean (SEM).
 Figure 1 of
Gao, Mol Vis 2011; 17:903-919.
Figure 1 of
Gao, Mol Vis 2011; 17:903-919.