Figure 3. DNA sequence chromatograms of an unaffected member and an affected member in the family (Forward strand; individual III:9
and III:10, respectively). A single transition is observed at position 559(C>T) as a C/T double peak (indicated by an arrow).
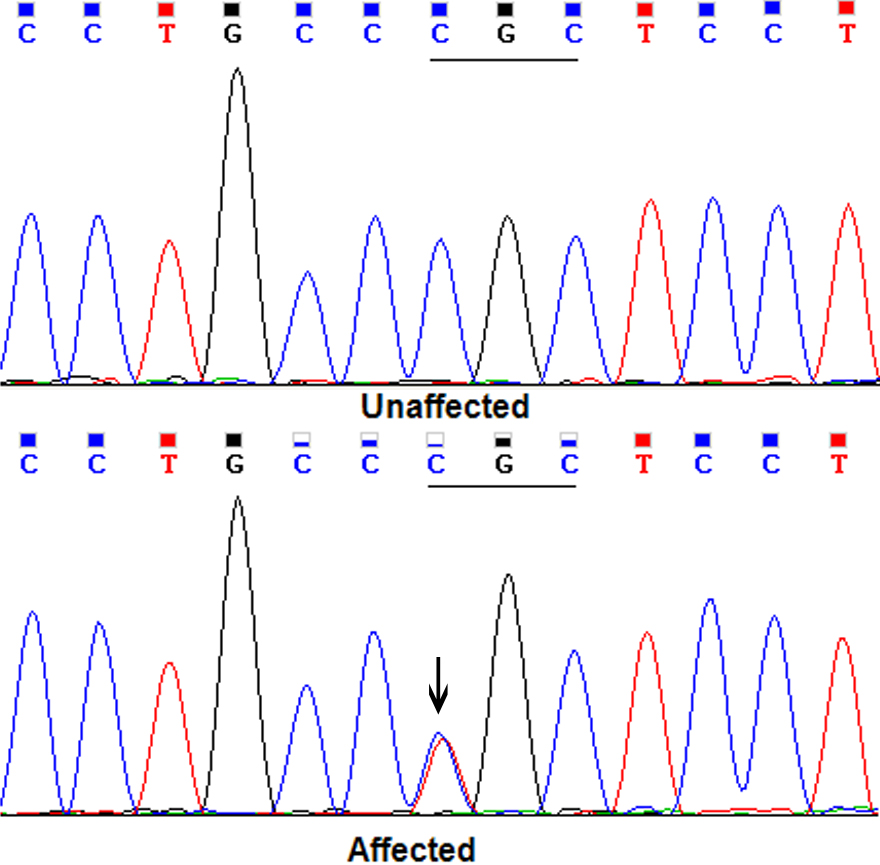
 Figure 3 of
Wang, Mol Vis 2011; 17:70-77.
Figure 3 of
Wang, Mol Vis 2011; 17:70-77.