Figure 2. PAGE showing differential
migration of affected samples by the SSCP method. The affected
individuals (III:1, III:2, and II:4) showed differential banding
pattern with an extra band on 8% PAGE and unaffected (II:3, II:5, and
III:3) showed normal banding pattern. Arrow indicated the extra band
and asterisk indicate the lanes showing differential migration.
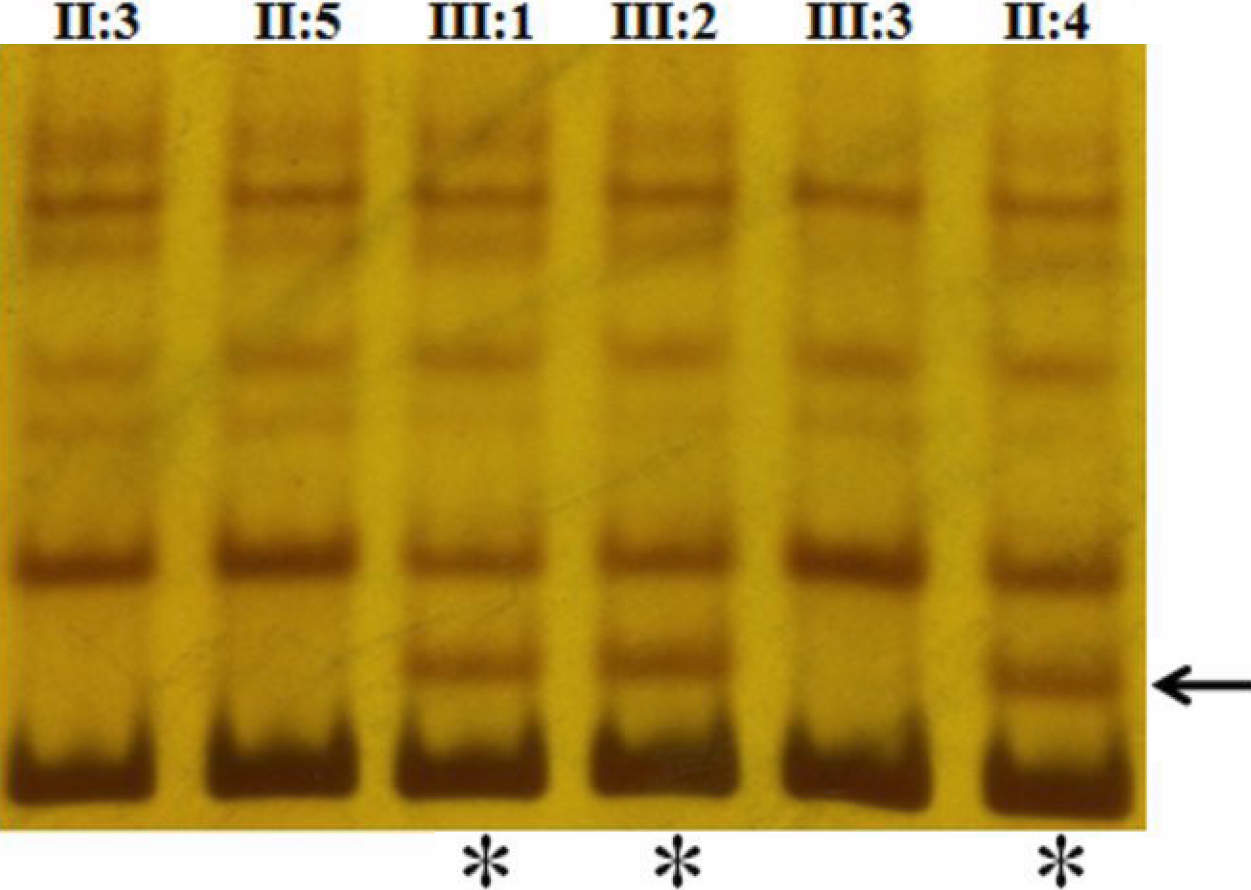
 Figure 2 of Roshan, Mol Vis 2010; 16:887-896.