Figure 2 of
Ding, Mol Vis 2010; 16:855-861.
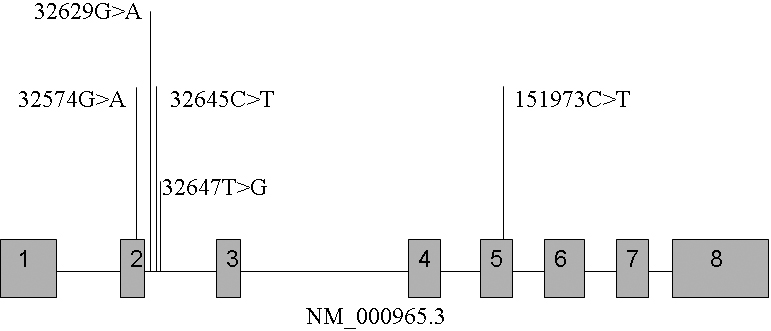
Figure 2.
Schematic diagram of the five single nucleotide polymorphisms within the
RARβ
gene. The gray rectangles represent exons and the lines represent introns.
 Figure 2 of
Ding, Mol Vis 2010; 16:855-861.
Figure 2 of
Ding, Mol Vis 2010; 16:855-861.