Figure 8. The mRNA expression of selected genes from microarray data was confirmed using real time quantitative reverse transcriptase
PCR (Q-RT–PCR). The black bars represent the mRNA levels quantified by Q-RT–PCR and the white bars represent the fold expression
of genes studied by microarray. The Q-RT–PCR results are consistent with microarray results. The error bars represent the
standard deviation of triplicate values. Abbreviations: PCNA represents proliferating cell nuclear antigen, CCDN3 represents
cyclin D3, FOS represents v-fos FBJ murine osteosarcoma viral oncogene homolog, JUN represents jun oncogene, and DRAM represents
damage-regulated autophagy modulator.
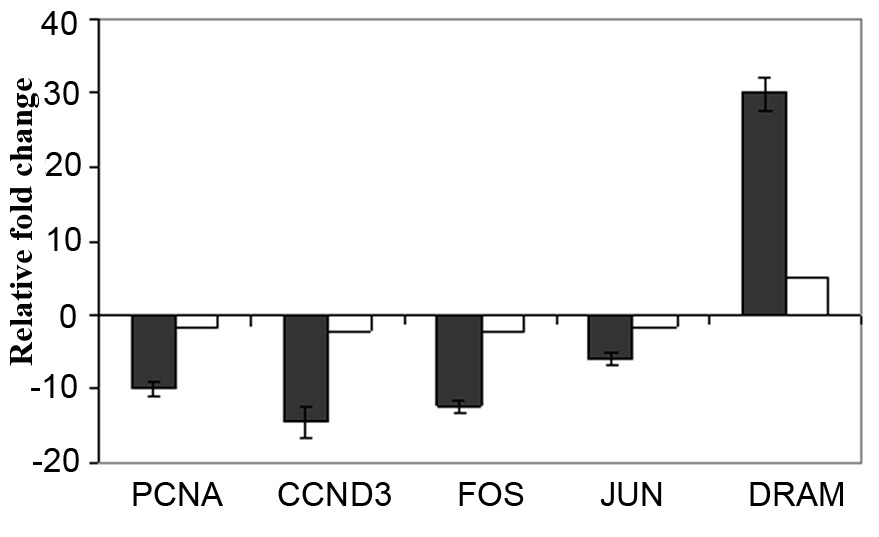
 Figure 8 of
Mitra, Mol Vis 2010; 16:828-842.
Figure 8 of
Mitra, Mol Vis 2010; 16:828-842.