Figure 6. Epithelial cell adhesion
molecule short interfering RNA treatment leads to changes in gene
expression profile in Y79 cells. The heat map represents the expression
profile of 100 genes differentially modified in response to knockdown
of epithelial cell adhesion molecule (Ep-CAM) in Y79 cells compared to
untreated cells. The horizontal lines represent the relative fold
change in the expression of individual genes modified by the
Ep-CAM-short interfering (si)RNA. Red and green indicate increased and
decreased expression, respectively, relative to nonsilencing control
siRNA.
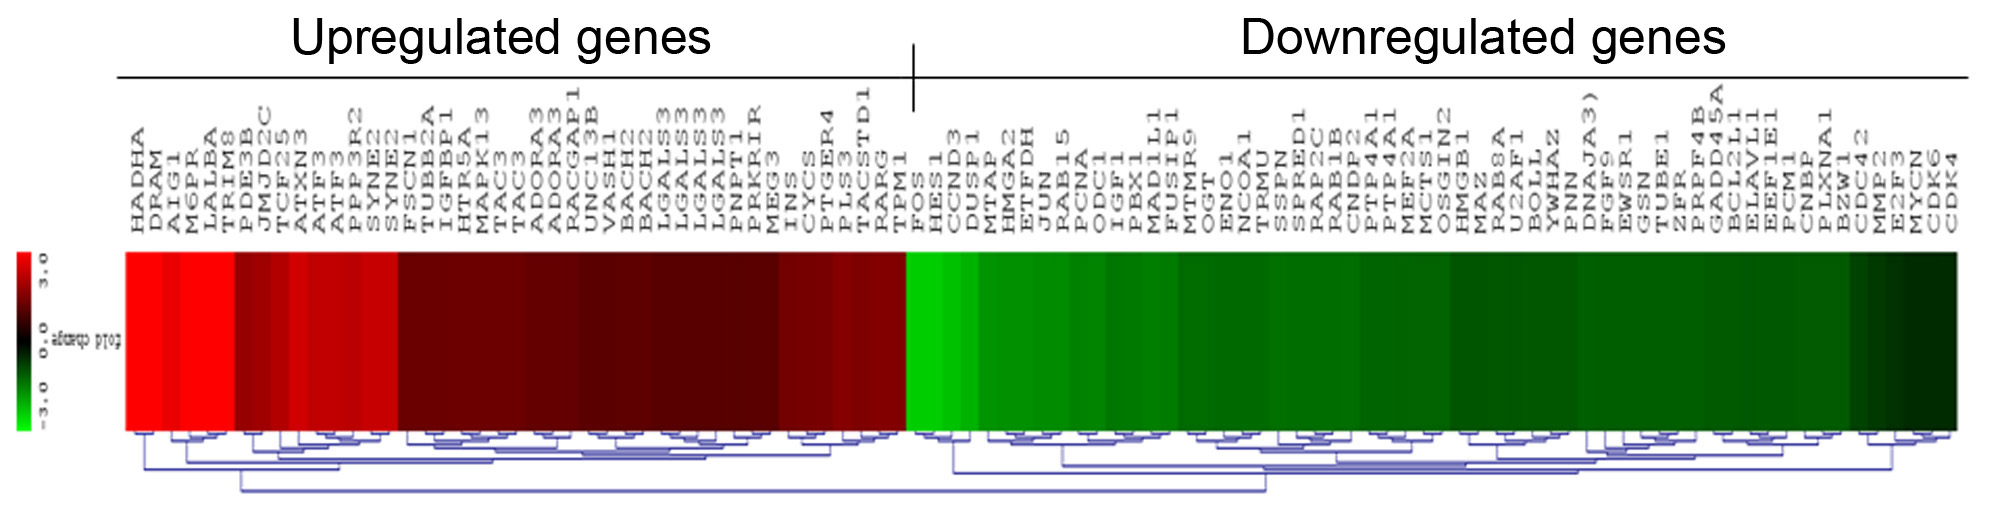
 Figure 6 of Mitra, Mol Vis 2010; 16:828-842.