Figure 4. Effect of osmotic stress on the
subcellular distribution of NCC and NKCC1 in the cortex of the rat
lens. Images from equatorial cryosections obtained from lenses organ
cultured in either isotonic, hypotonic or hypertonic AAH, and
doubled-labeled with either, NKCC1 or NCC specific antibodies (green),
and the membrane marker TRITC-WGA (red). A: Overview image of
fiber cell morphology in the lens cortex taken from a lens incubated
under isotonic conditions to indicate the relative locations of the
efflux and influx zones. B, C: Representative high
power images of NCC (B) and NKCC1 (C) labeling taken from
the efflux (top panels) and influx (lower panels) zones from lenses
incubated for 18 h in isotonic (left column), hypotonic (middle
column), and hypertonic (right column) AAH for 18 h.
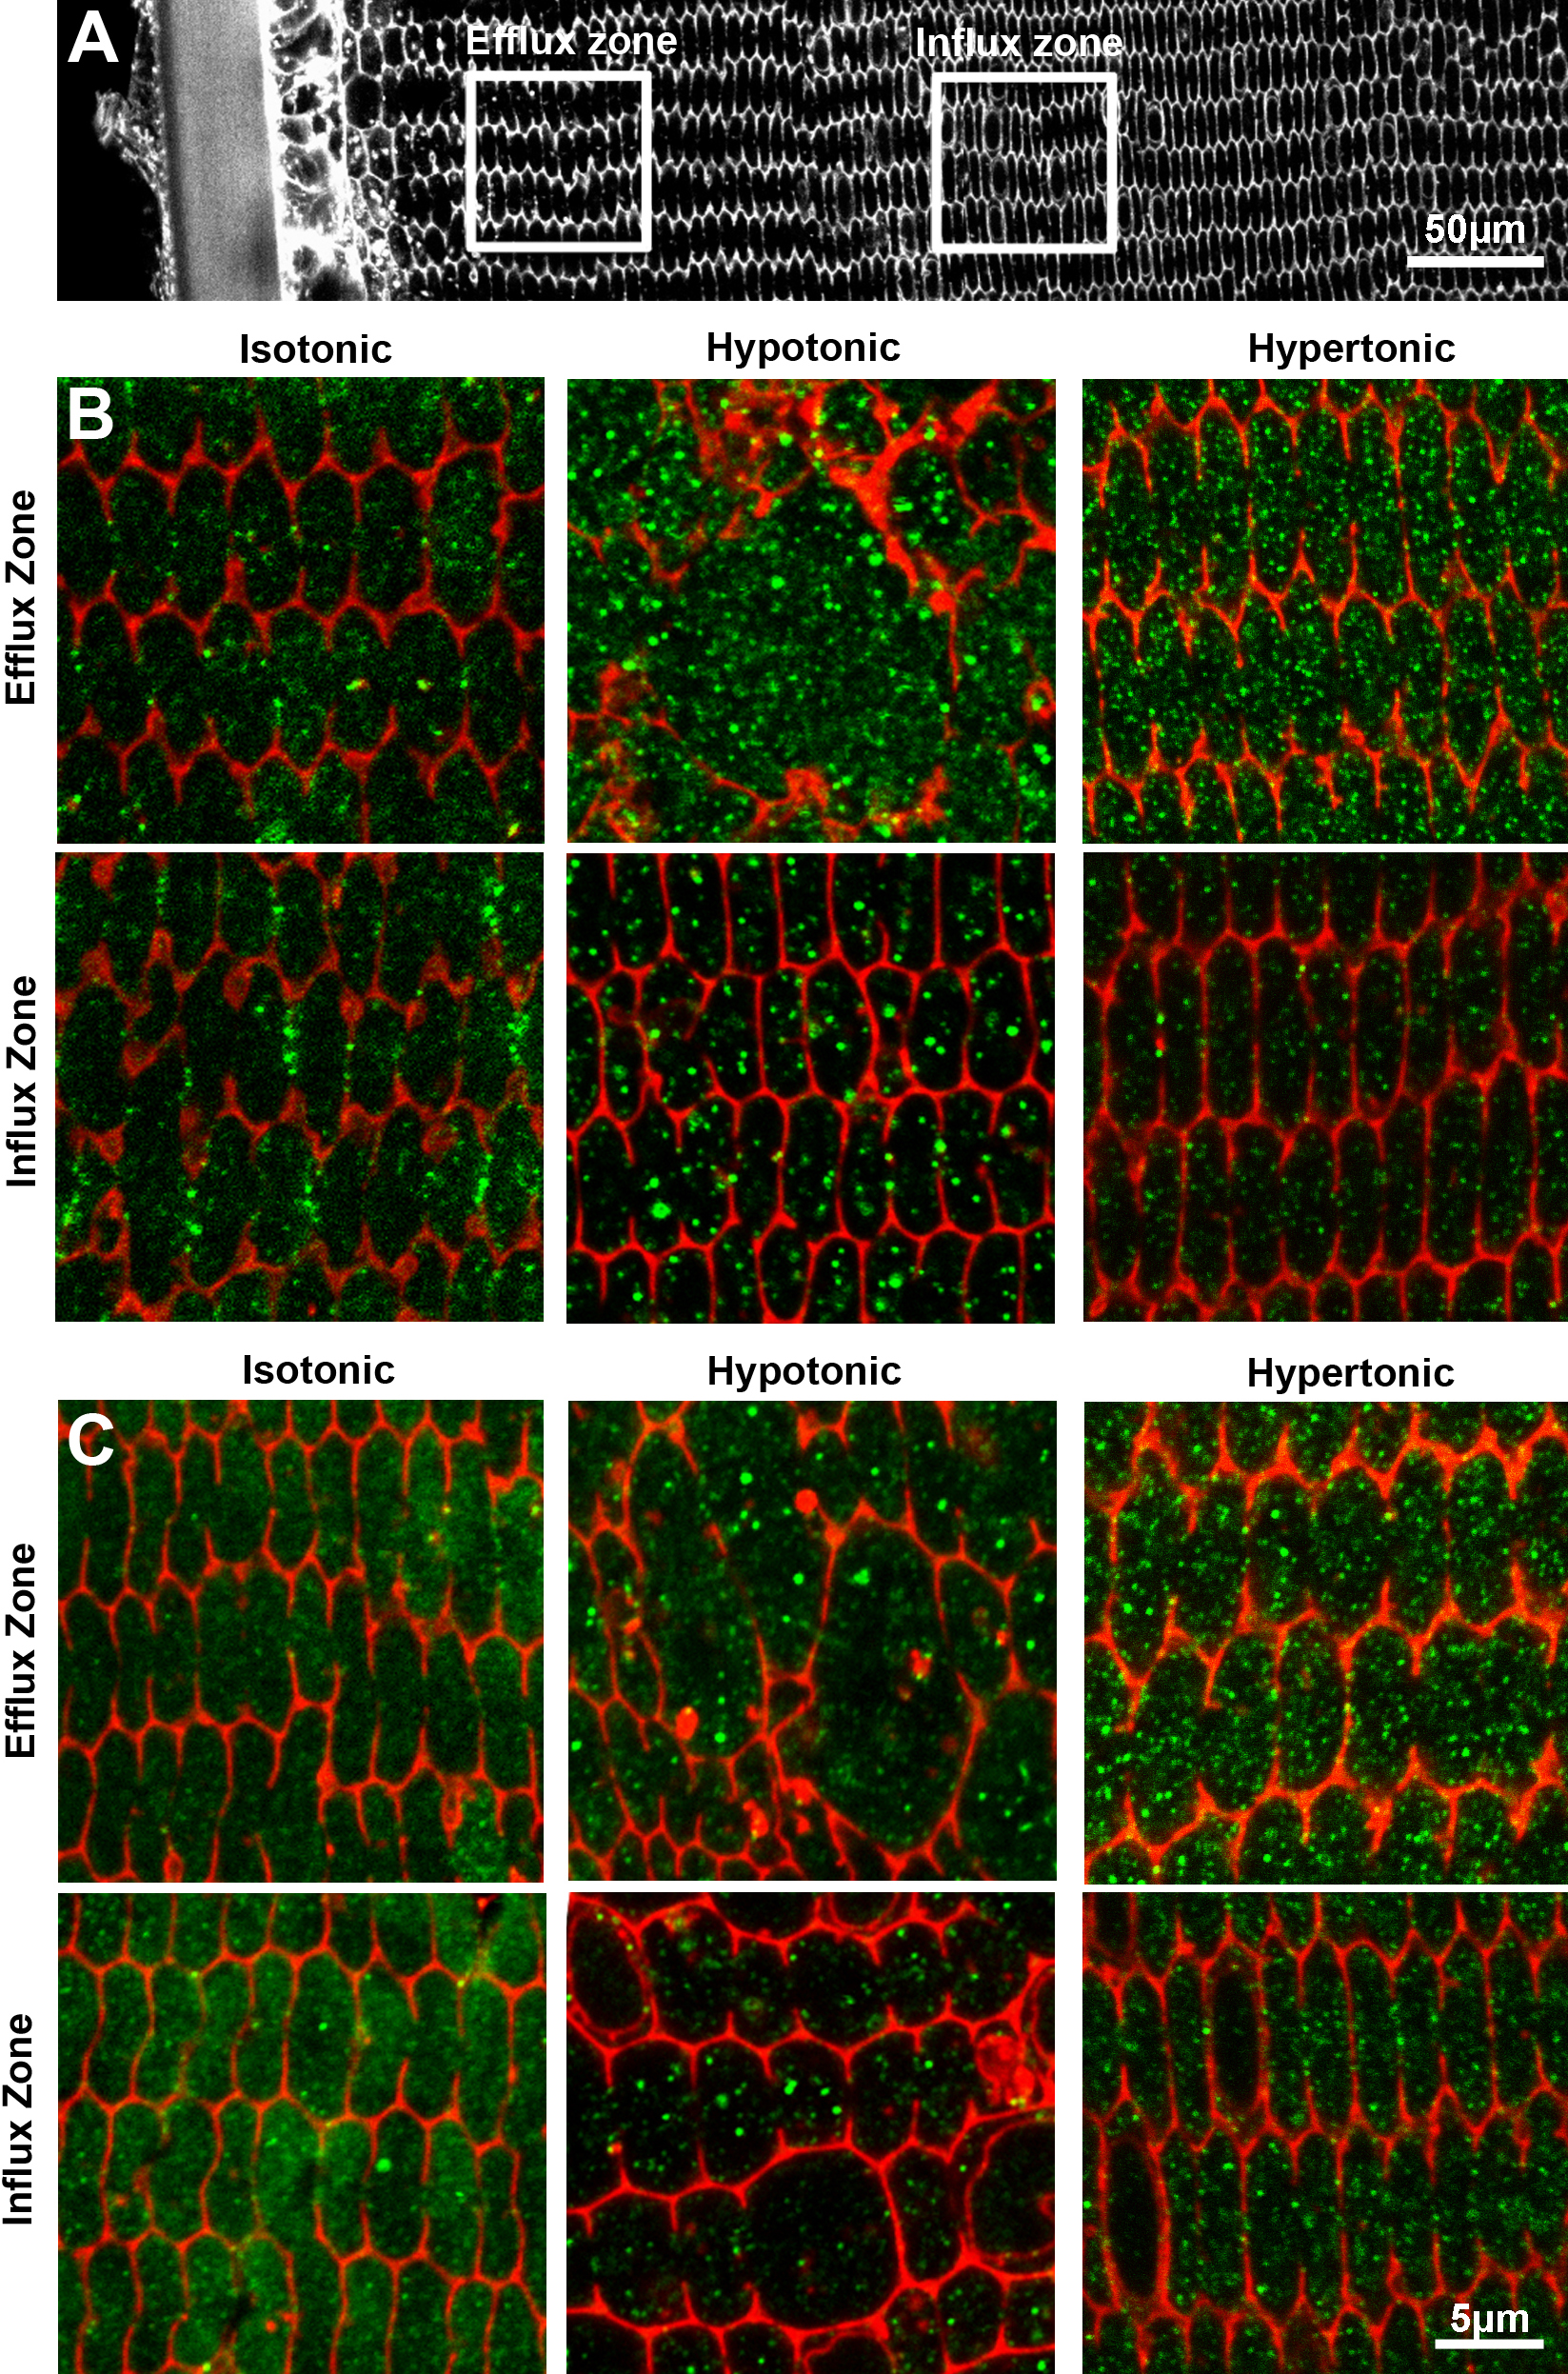
 Figure 4 of Chee, Mol Vis 2010; 16:800-812.