Figure 5. Electroretinogram (ERG) of the
normal and affected members of the families RP26 and RP44. The photopic
ERGs (A, C) of the unaffected individuals (RP26_IV:2,
RP44_IV:6) of families RP26 and RP44 indicated normal cone responses.
In comparison, the affected individuals (RP26_V:2, RP44_IV:1) of both
families had residual cone responses (B, D).
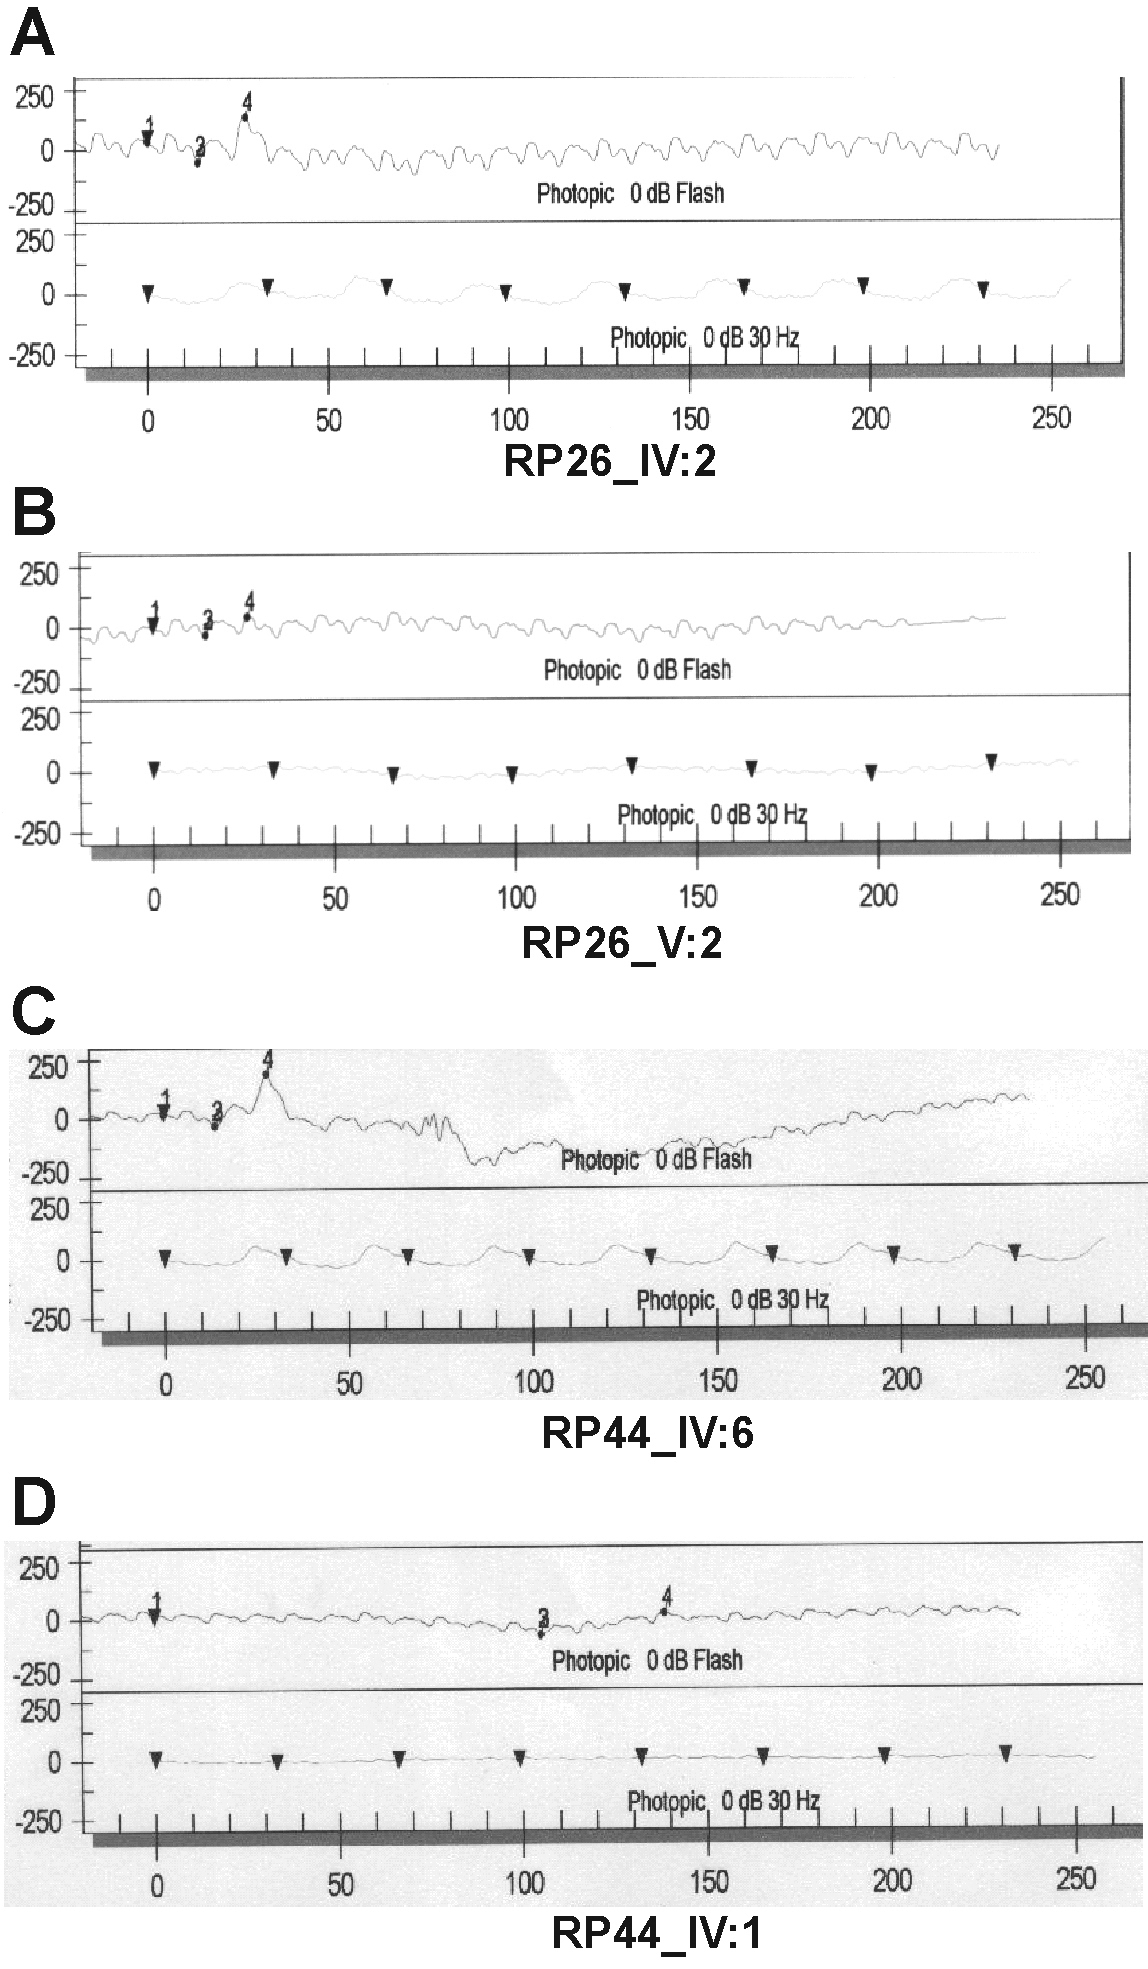
 Figure 5 of Azam, Mol Vis 2010; 16:774-781.