Figure 4. Quantitative PCR validation of expression changes induced by exposure to hyperoxia in a selected cohort of genes. For each
gene, the change was estimated in both the superior and inferior retina by microarray analysis and qPCR. The results of qPCR
were averaged from three independent experiments, with the error bar indicating the standard error of the mean. Fold ratio
values >1 indicate an upregulation and values <1 indicate a downregulation. Where FR=1 (dotted line), expression was unchanged.
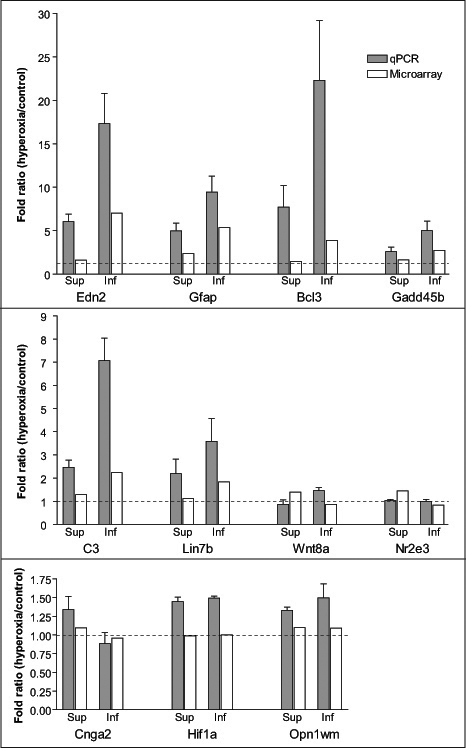
 Figure 4 of
Zhu, Mol Vis 2010; 16:740-755.
Figure 4 of
Zhu, Mol Vis 2010; 16:740-755.