Figure 8. Comparison of the wild-type (A)
shown
in blue and mutant conformers (B) shown in green obtained
after Molecular Dynamics (MD) simulations. Difference in distances of
wild type (4.9Ǻ) and mutant (2.5 Ǻ) are indicated. The change in
secondary structure element is due to formation of hydrogen bond
interactions shown by dashed lines.
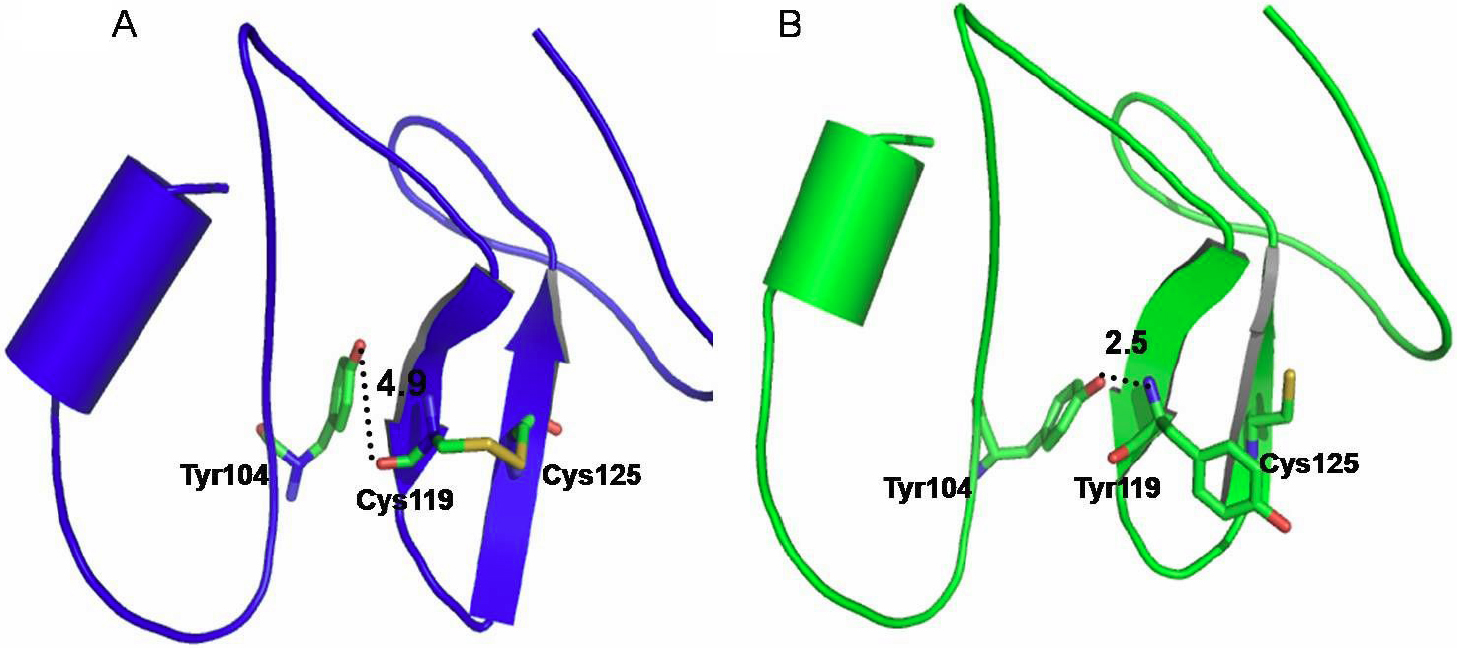
 Figure 8 of Paliwal, Mol Vis 2010; 16:729-739.