Figure 7. Schematic representation of both wild type (A) and mutant (B) tumor associated calcium signal transducer 2 (TACSTD2) protein. The modeled structure is encircled in black. The abbreviations
used are: epidermal growth factor (EFG)-like repeat, a thyroglobulin type 1A (TY) repeat, a transmembrane domain (TM) and
a phosphatidylinositol (PIP2)- binding site, L1, L2, L3 are loops, H1 is helix while B1 and B2 are anti-parallel b-sheets
. The free cysteine residue in the mutant protein is depicted by ~S- and disulphide bridges by dashed lines.
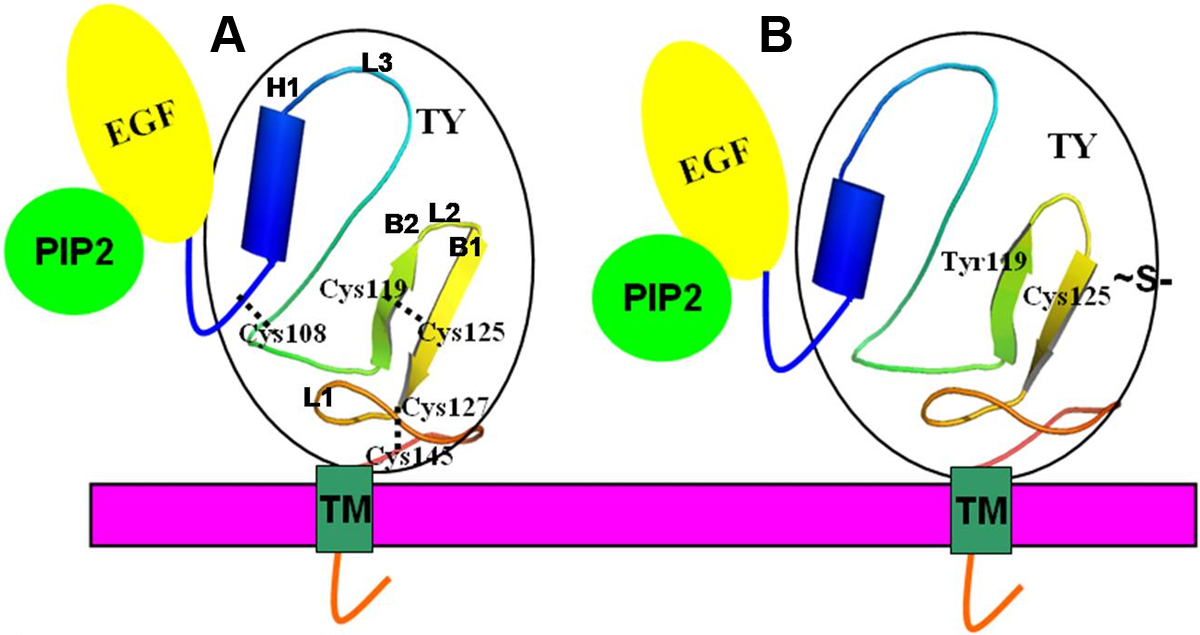
 Figure 7 of
Paliwal, Mol Vis 2010; 16:729-739.
Figure 7 of
Paliwal, Mol Vis 2010; 16:729-739.