Figure 5. Digital quantification of VEGF-induced corneal neovascularization in enalapril-treated (white bar) and enalapril-untreated
control (black bar) eyes of live rabbit performed on days 4, 9, and 14. ψ denotes a p<0.01 and shows a significant value of
corneal neovascularization on day 9 and 14 compared to day 4; * denotes a p<0.05 and shows a significant value of corneal
neovascularization in enalapril-treated rabbit compared to enalapril-untreated controls. Bars represent standard error.
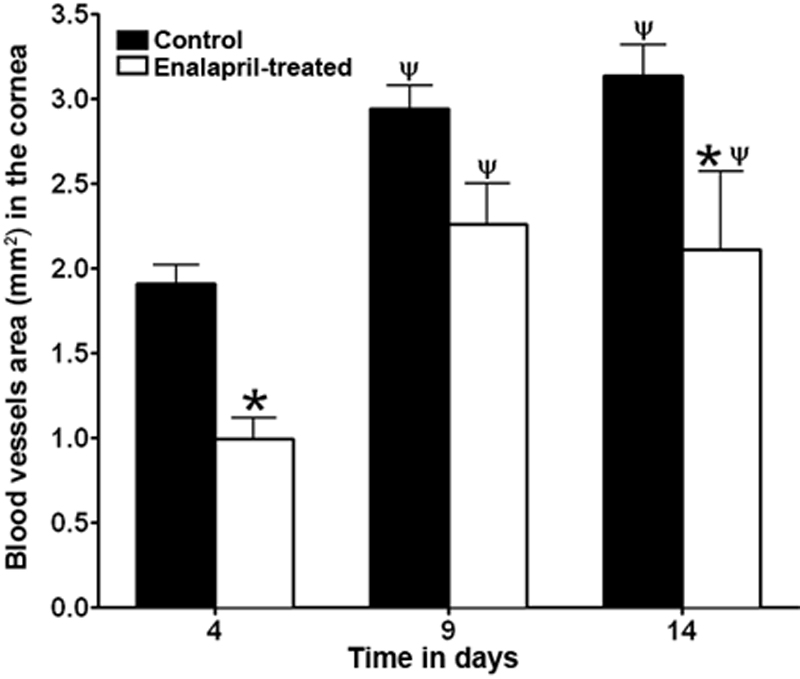
 Figure 5 of
Sharma, Mol Vis 2010; 16:720-728.
Figure 5 of
Sharma, Mol Vis 2010; 16:720-728.