Figure 1. Representative image showing detection of ACE, AT1, and AT2 mRNA expression in rabbit corneal fibroblasts with PCR. Appropriate size amplification products for ACE (469 bp), AT1 (463 bp), and AT2 (551 bp) were detected in two independent cDNA samples of corneal fibroblast prepared from different rabbits. -ve con denotes
negative controls that contained ACE, AT1, or AT2 primers but water instead of cDNA. + ve con represents the positive control of β-actin (ACTB; 350 bp). L denotes 1 kb plus the DNA ladder.
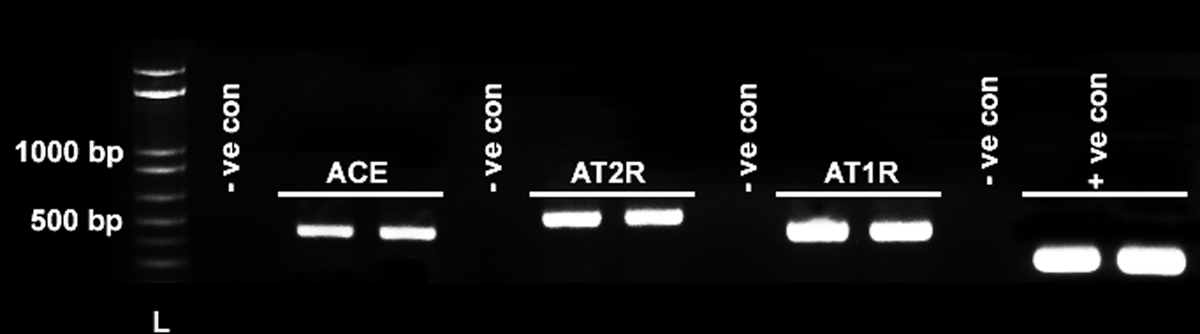
 Figure 1 of
Sharma, Mol Vis 2010; 16:720-728.
Figure 1 of
Sharma, Mol Vis 2010; 16:720-728.