Figure 7. Histograms represent the fold changes in cross-linked actin networks to cell number ratios. The ratio for untreated NTM cells
was arbitrarily set as 1. DEX caused a significant increase in cross-linked actin network (CLAN) numbers in both NTM and GTM
cells compared to their respective untreated control. The asterisk indicates data significantly different from the respective
untreated control at p≤0.05; the scale bar is 20 μm.
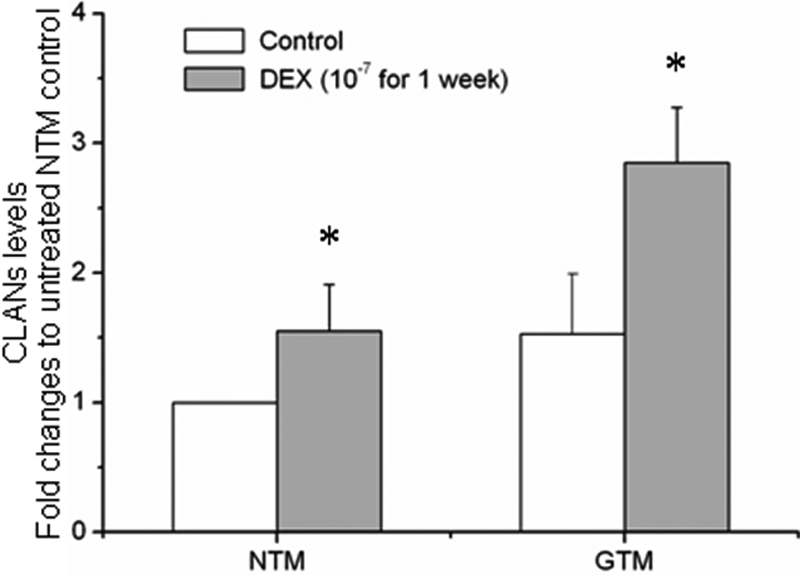
 Figure 7 of
Zhuo, Mol Vis 2010; 16:61-71.
Figure 7 of
Zhuo, Mol Vis 2010; 16:61-71.