Figure 3. Effect of all-trans-retinoic acid (RA) on Fbln1 mRNA levels in human scleral fibroblasts (HSFs). Fbln1 mRNA levels were measured with real-time PCR analysis after cells were treated with various doses of RA. Fbln1 mRNA abundance is expressed as cDNA copy numbers relative to copies of GAPDH. A: The ratio represents the ratio of Fbln1 to GAPDH in control (0.1% DMSO) and treated HSFs after 24 h of incubation time with various doses of RA. Asterisks show significant
differences relative to the appropriate control ratio (p<0.001). B: The ratio represents the ratio of Fbln1 to GAPDH in HSFs with 10−7 M RA treatment compared to control after different incubation time (12, 24, and 48 h).The ratio of the RA is divided by the
ratio of the respective control. Data are the mean±SD. Measures were repeated three times.
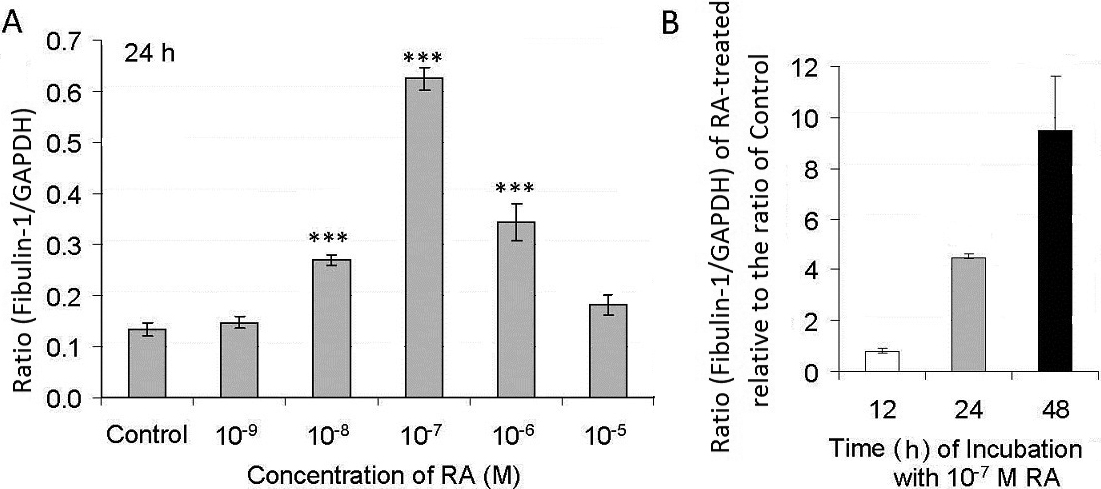
 Figure 3 of
Li, Mol Vis 2010; 16:689-697.
Figure 3 of
Li, Mol Vis 2010; 16:689-697.