Figure 2. Effect of all-trans-retinoic acid (RA) on the numbers of cultured human scleral fibroblasts at 24 h or 48 h. Numbers of live
cells were determined using the cell counting Kit-8. The results are shown as the numbers of live cells in the cultures with
RA, as a percentage of the numbers in control cultures (mean±SD). Asterisks indicate significant differences when compared
with the control without RA (p<0.001).
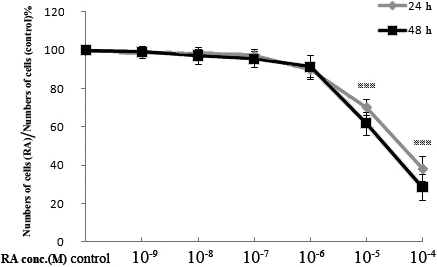
 Figure 2 of
Li, Mol Vis 2010; 16:689-697.
Figure 2 of
Li, Mol Vis 2010; 16:689-697.