Figure 4. The mutation was detected by heteroduplex-SSCP analysis. Abnormal migrational SSCP band patterns in the mutation are demonstrated
as compared with normal. Line 1, sample from the affected individual; lines 2 through 6, Samples from unaffected control individuals
(NC). The arrow indicates the band that is different from the NC samples.
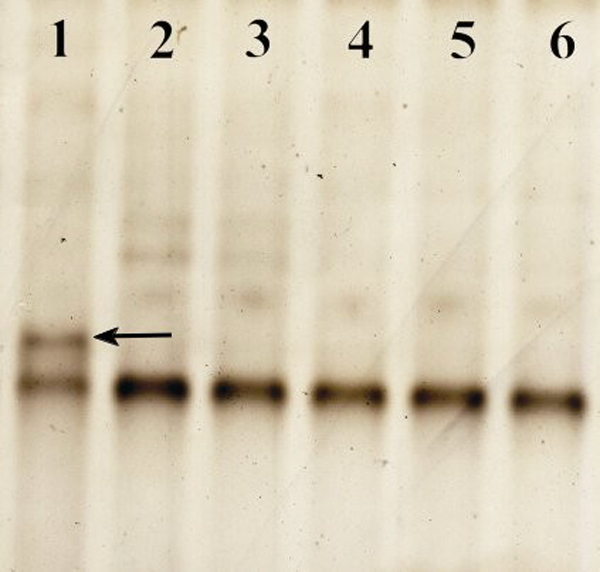
 Figure 4 of
Jia, Mol Vis 2010; 16:676-681.
Figure 4 of
Jia, Mol Vis 2010; 16:676-681.