Figure 5. Pure tone audiometry. Pure tone
audiometry (250–8000 Hz) in the two affected siblings. The initial
recording is shown as a dashed line, and the second recording (about 1
year later) as a solid line. A: This panel shows pure tone
audiometric thresholds of over a 1-year period of patient IV:1. B:
This
panel shows pure tone audiometric thresholds of over an 18-month
period of patient IV:2.
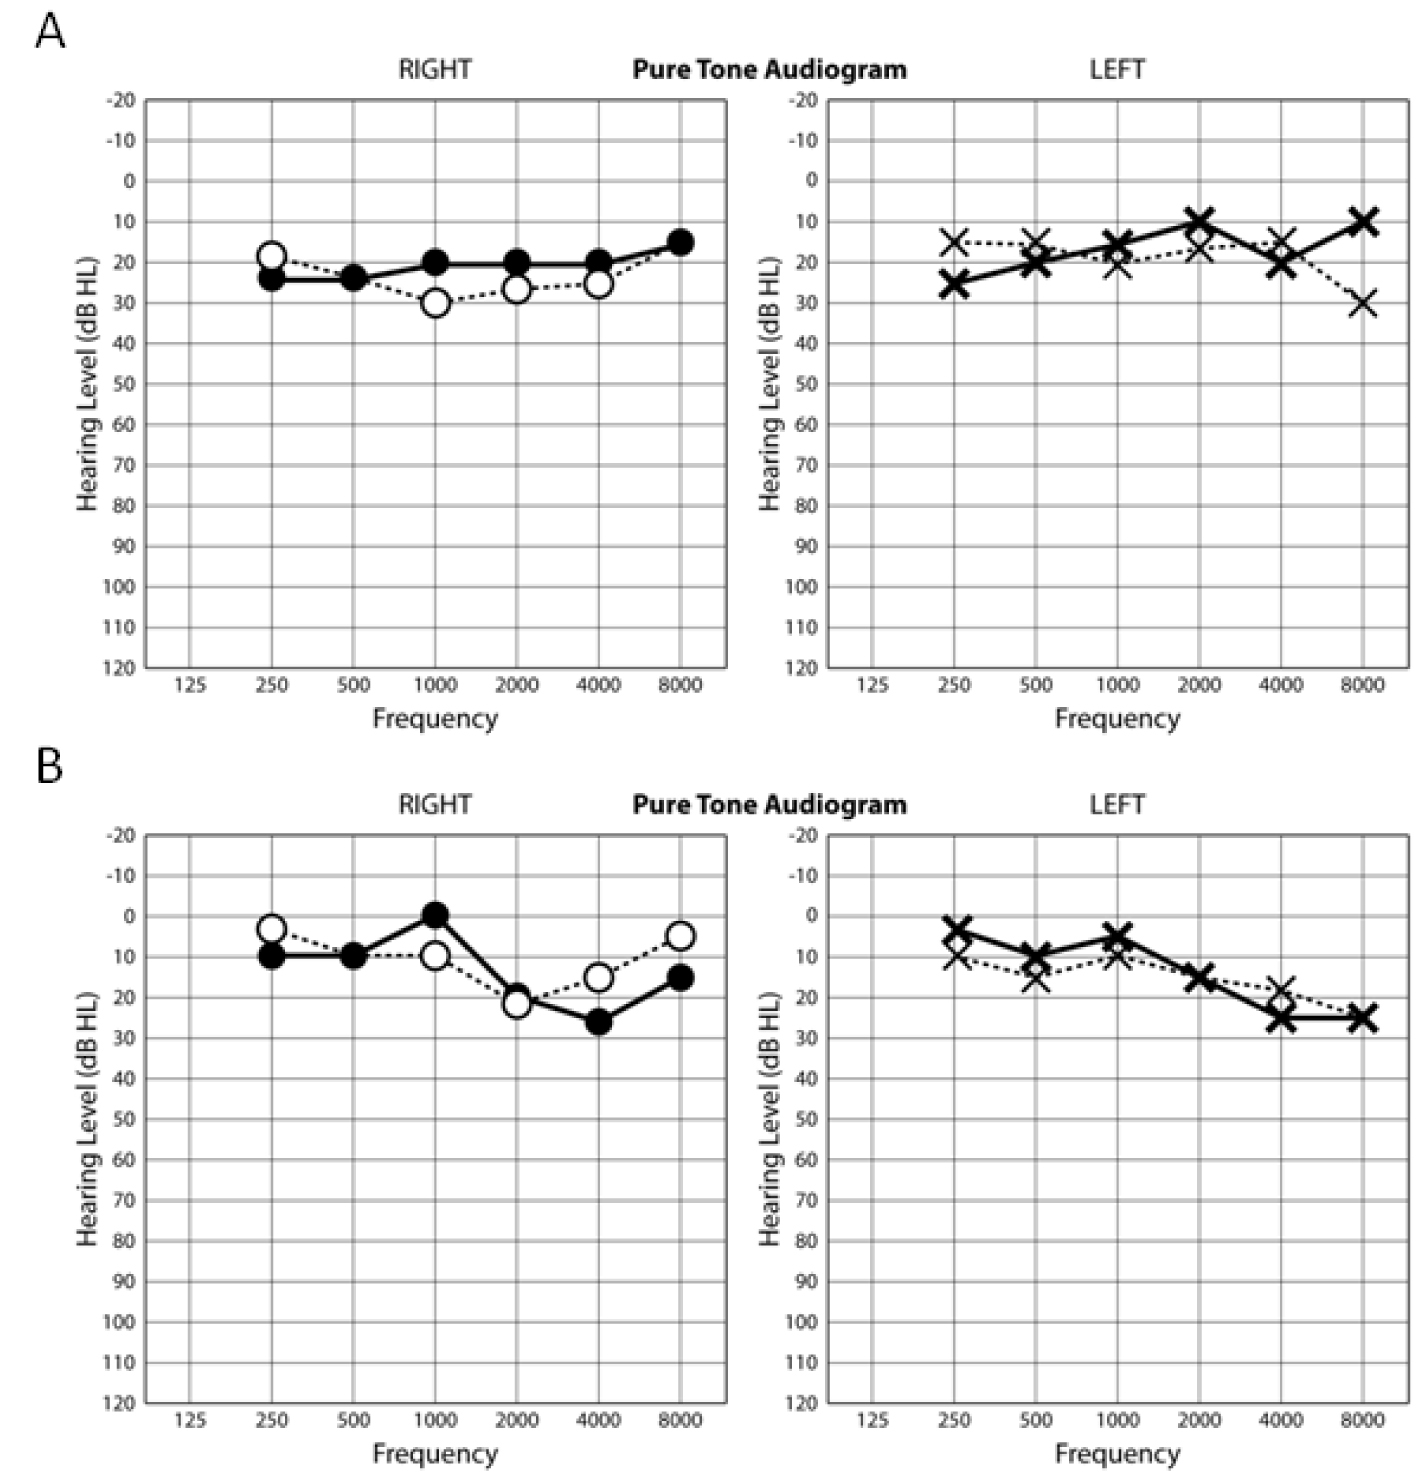
 Figure 5 of Meyer, Mol Vis 2010; 16:650-664.