Figure 4. Pattern cortical visual evoked
potentials, flash cortical visual evoked potentials, and pattern
electroretinograms of the two affected individuals with mutation in the
transmembrane protein 126A gene. In row 1 are the results from the
right and in row 2 from the left eye of patient IV:2, in row 3 from the
right and in row 4 from the left eye of patient IV:1, and in row 5 and
the bottom row from normal examples for comparison. Illustrated pattern
cortical visual evoked potentials (VEPs) from patient IV:2 were
recorded to a large checkerboard field (24°×30°); those from patient
IV:1 were recorded to a standard checkerboard field (12°×15°).
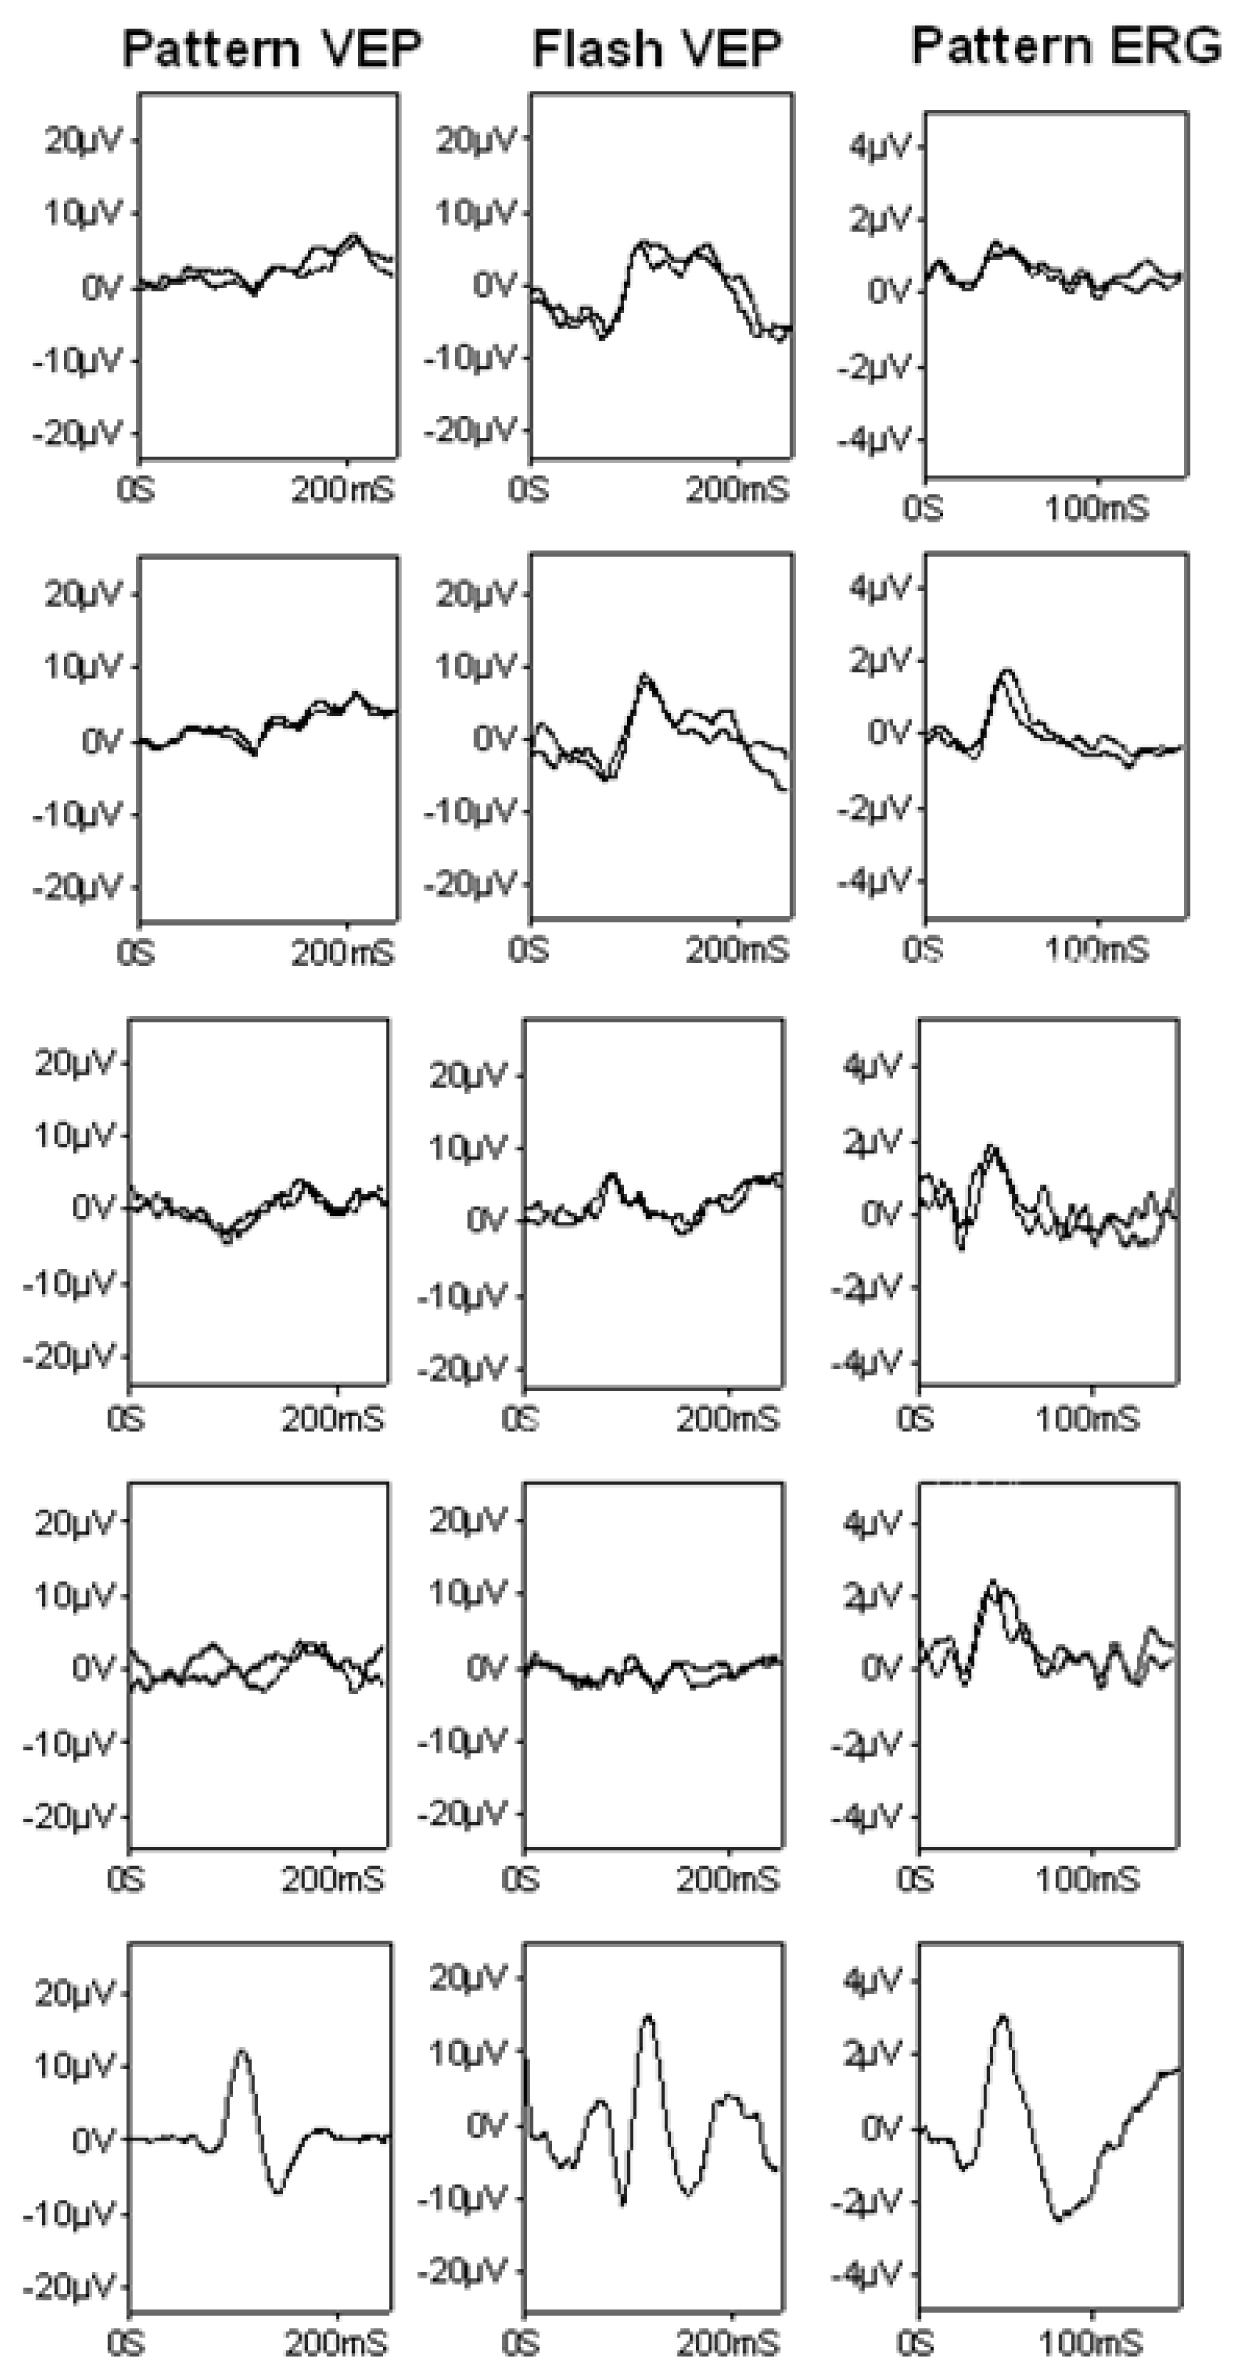
 Figure 4 of Meyer, Mol Vis 2010; 16:650-664.