Figure 3. International-standard
full-field electroretinogram of the two affected individuals of the
optic atrophy family. This figure shows the electroretinogram (ERGs)
from the right (row 1) and left (row 2) eye of patient IV:2, from the
right (row 3) and left (row 4) eye of patient IV:1, and typical normal
examples for comparison (row 5, bottom row). Dark-adapted ERGs are
shown for flash intensities of 0.01 and 11.5 cd seconds per square
meter (cd.s.m−2); light adapted ERGs are shown for 30 Hz
flicker and 2 Hz stimulation at a flash intensity of 3.0 cd.s.m−2.
ON-OFF
ERGs used an orange stimulus (560 cds per square meter [cd.m−2],
duration
200 ms) superimposed on a green background (150 cd.m−2).
S-cone ERGs used a blue stimulus (445 nm, 80 cd.m−2) on an
orange background (620 nm, 560 cd.m−2). Broken lines replace
blink artifacts occurring just after the b-wave peak in patient IV:1.
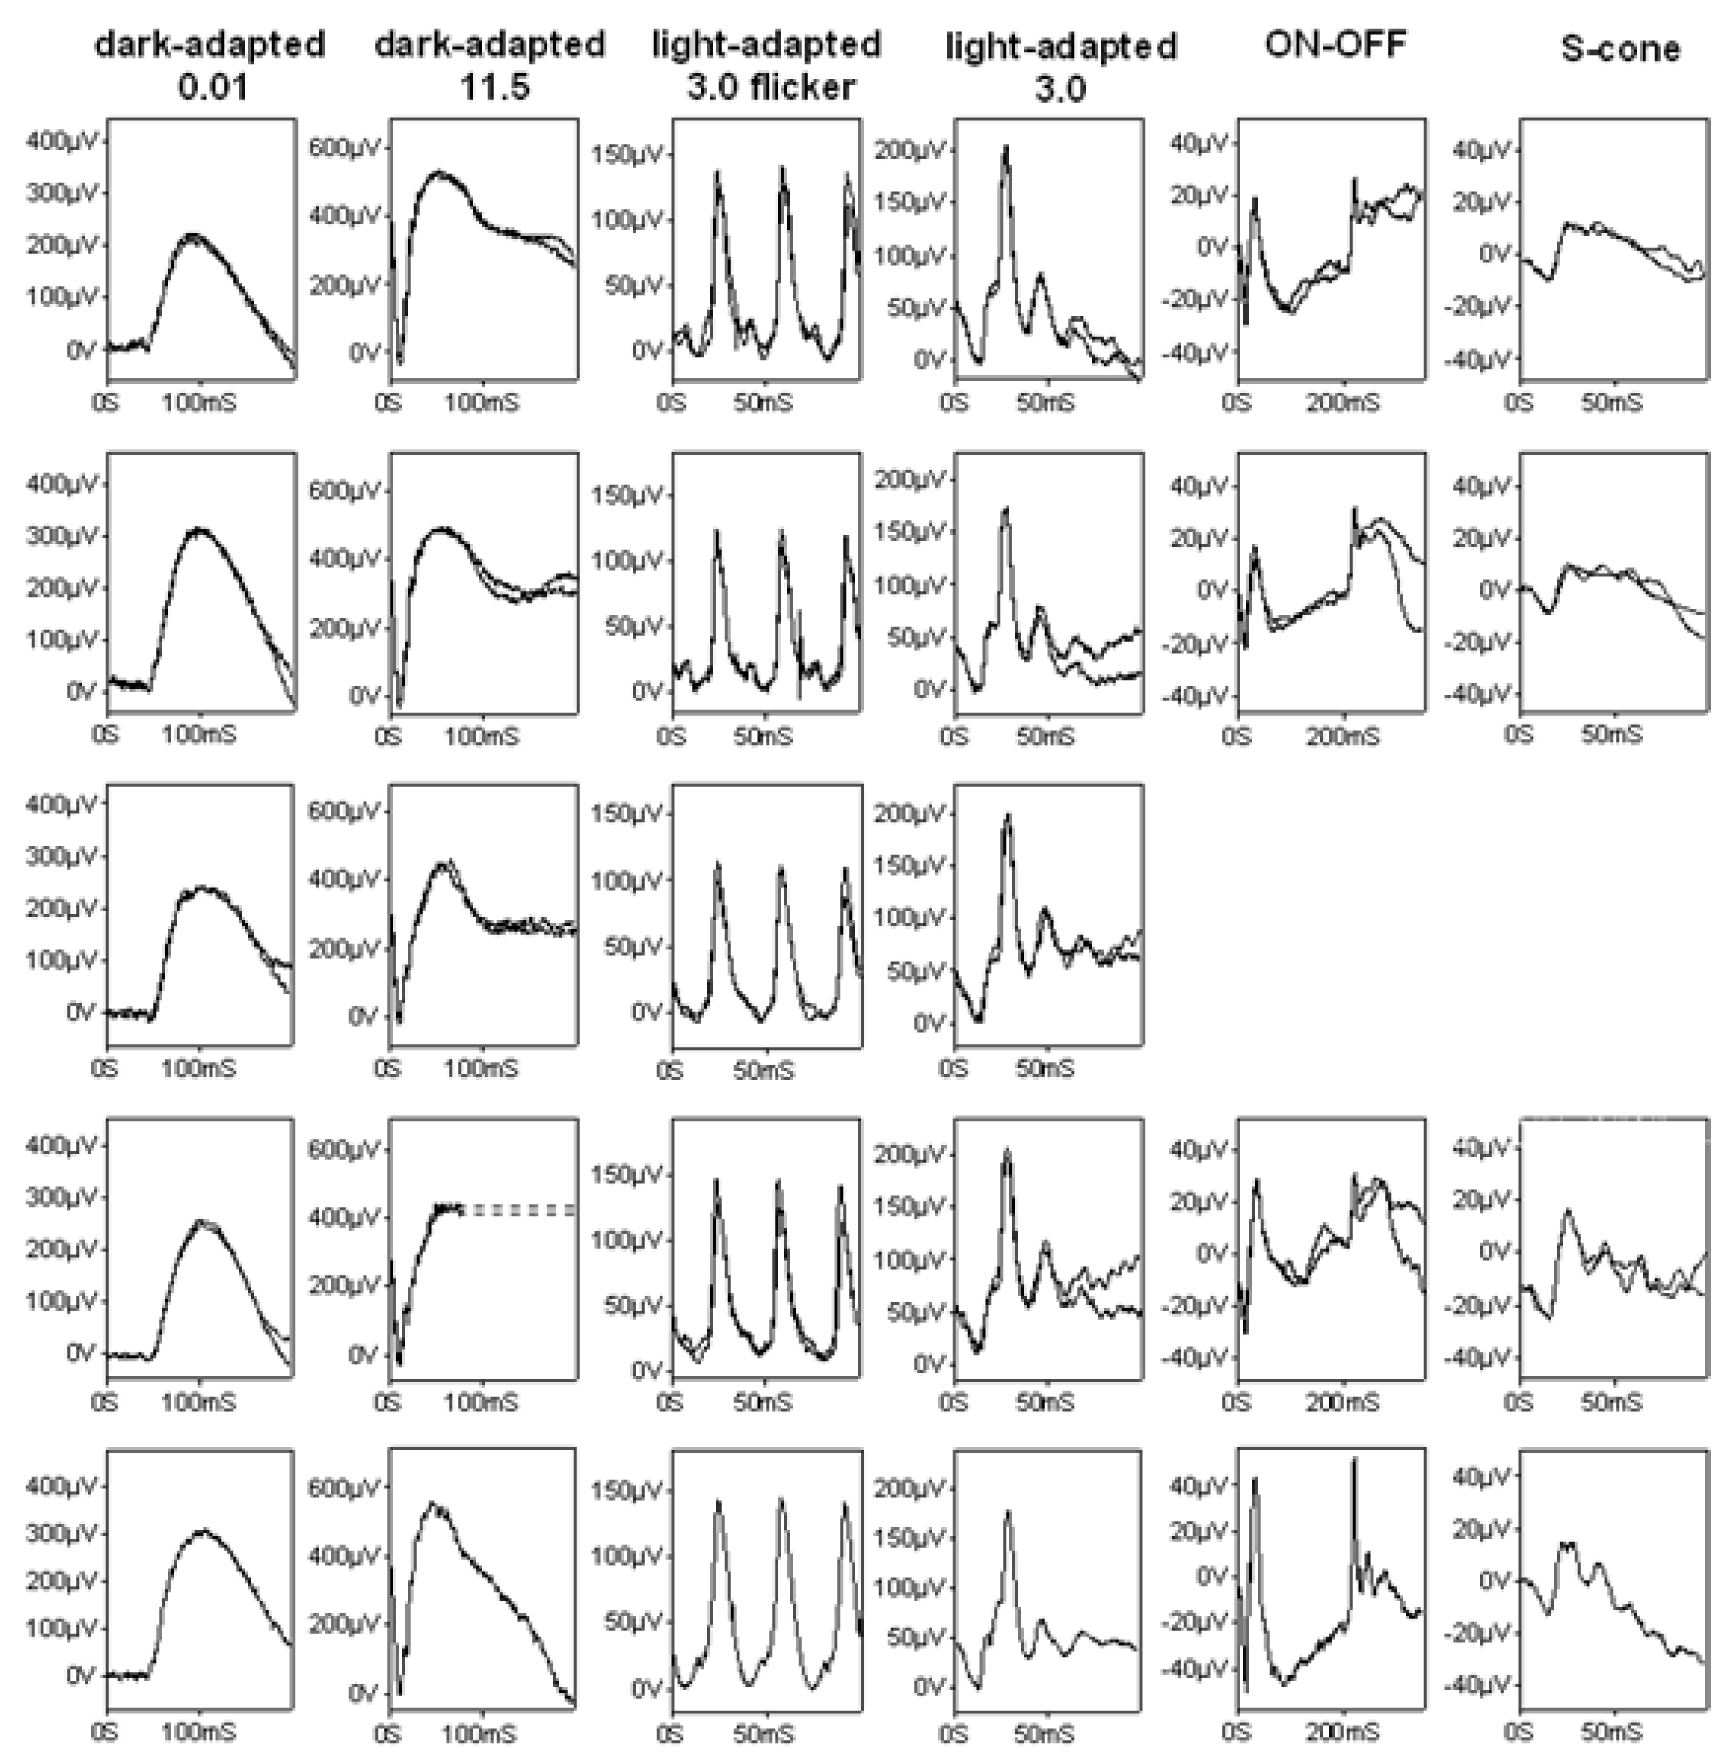
 Figure 3 of Meyer, Mol Vis 2010; 16:650-664.