Figure 3. Changes in ZENK RNA
transcript levels in the chick retina over a 24 h time period. ZENK
transcript levels in the retina were significantly suppressed following
1 h of form-deprivation, and remained suppressed during the subsequent
dark phase and the beginning of the following light phase, as compared
to age-matched control values (ANOVA; F (2,46)=23.45, p<0.001) and
contralateral control values (ANOVA; F (2,46)=13.34, p<0.01). The
mean normalized expression is calculated from the efficiency (E)
of the target genes to the power of its average CT value (ECT,
target),
divided by the efficiency (E) of the reference gene
(β-actin) to the power of its average CT value (ECT,
reference). Error bars represent SEM, n=5.
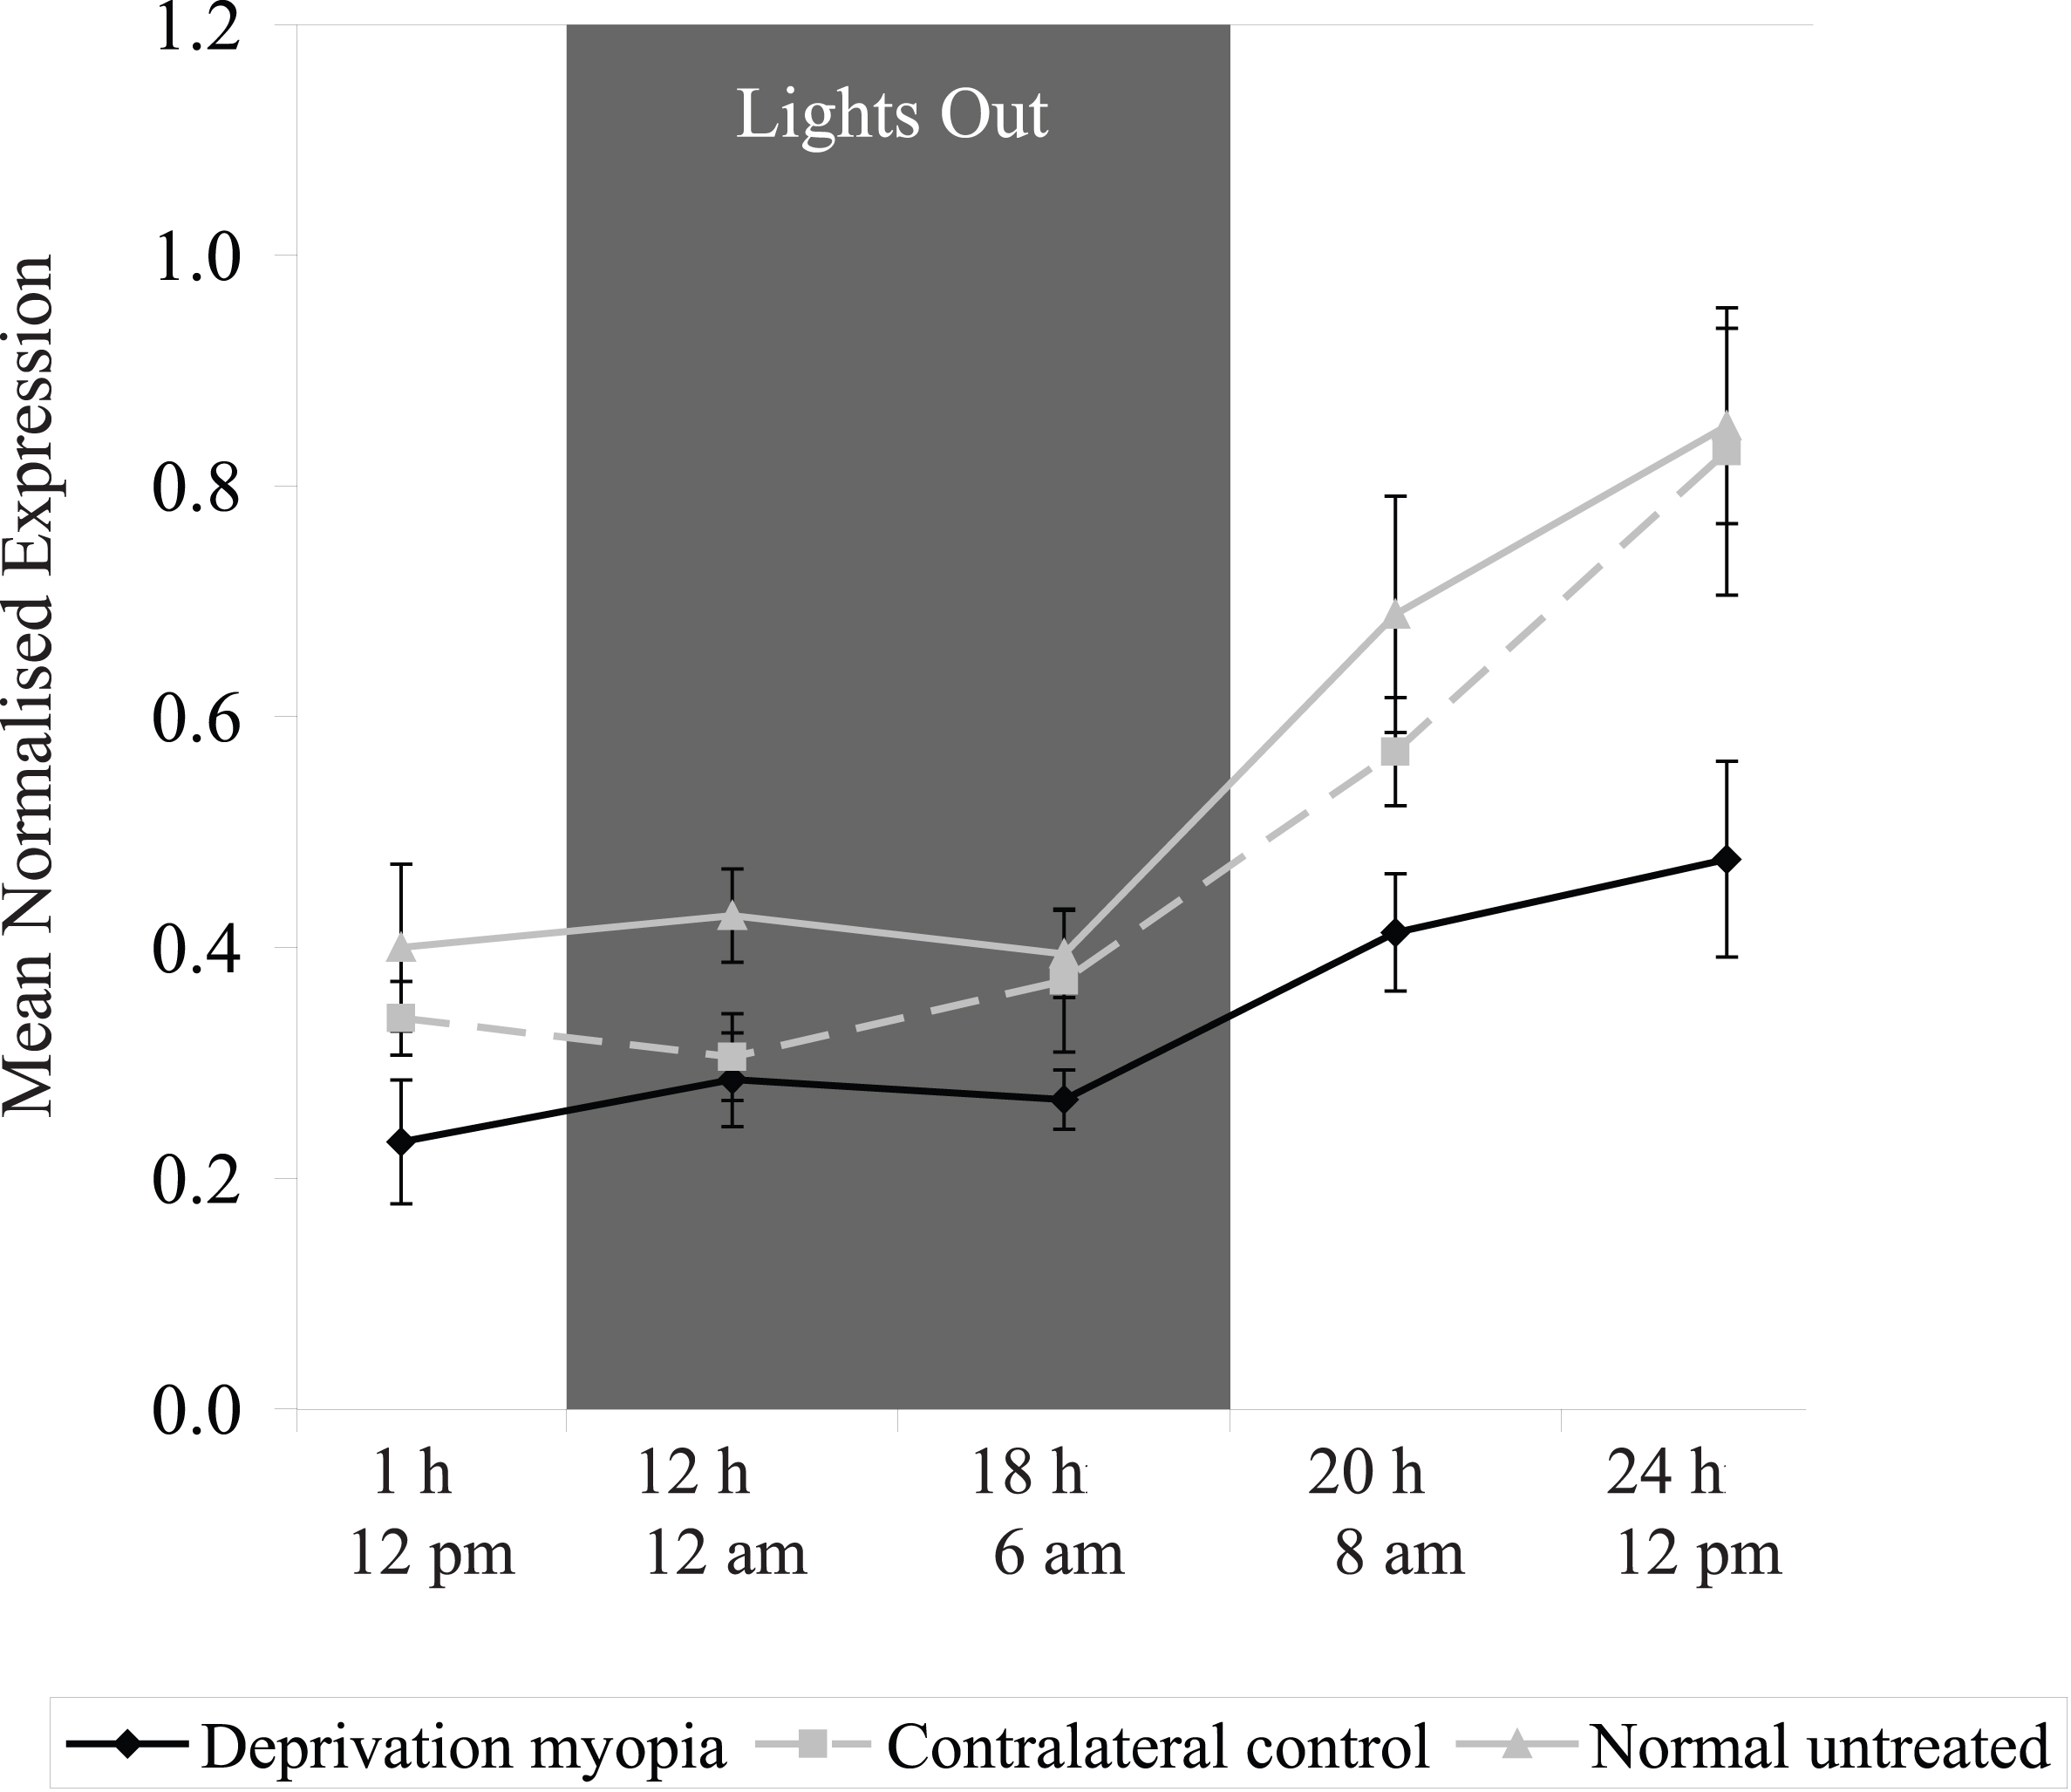
 Figure 3 of Ashby, Mol Vis 2010; 16:639-649.