Figure 2. Immunoflourescent analysis of natriuretic peptide receptor expression in HLE-B3 cells. Immunoflourescence and confocal microscopy
was used to determine expression of natriuretic peptide receptors on HLE-B3 cells. Control images included HLE-B3 cells incubated
with no primary antibody but with a goat-anti-rabbit secondary and cells incubated with rabbit IgG as the primary antibody.
The data are typical of images representative of eight random fields of view per receptor taken from two independent populations
of cells. The scale bar equals 50 microns.
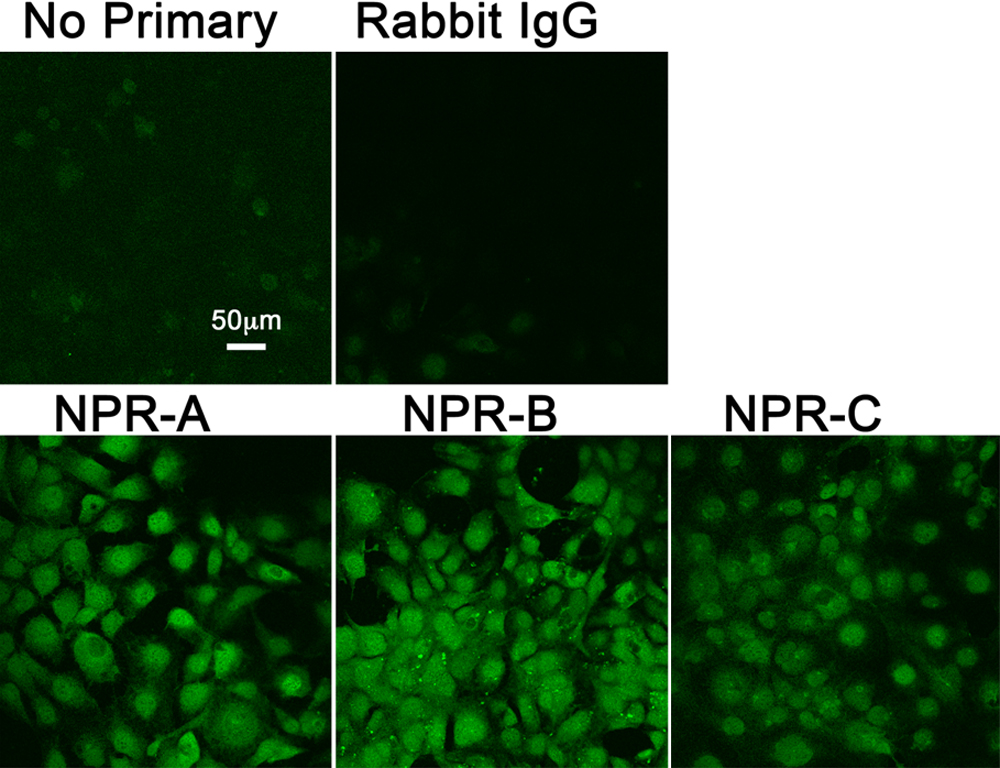
 Figure 2 of
Cammarata, Mol Vis 2010; 16:630-638.
Figure 2 of
Cammarata, Mol Vis 2010; 16:630-638.