Figure 3 of
Lu, Mol Vis 2010; 16:611-622.
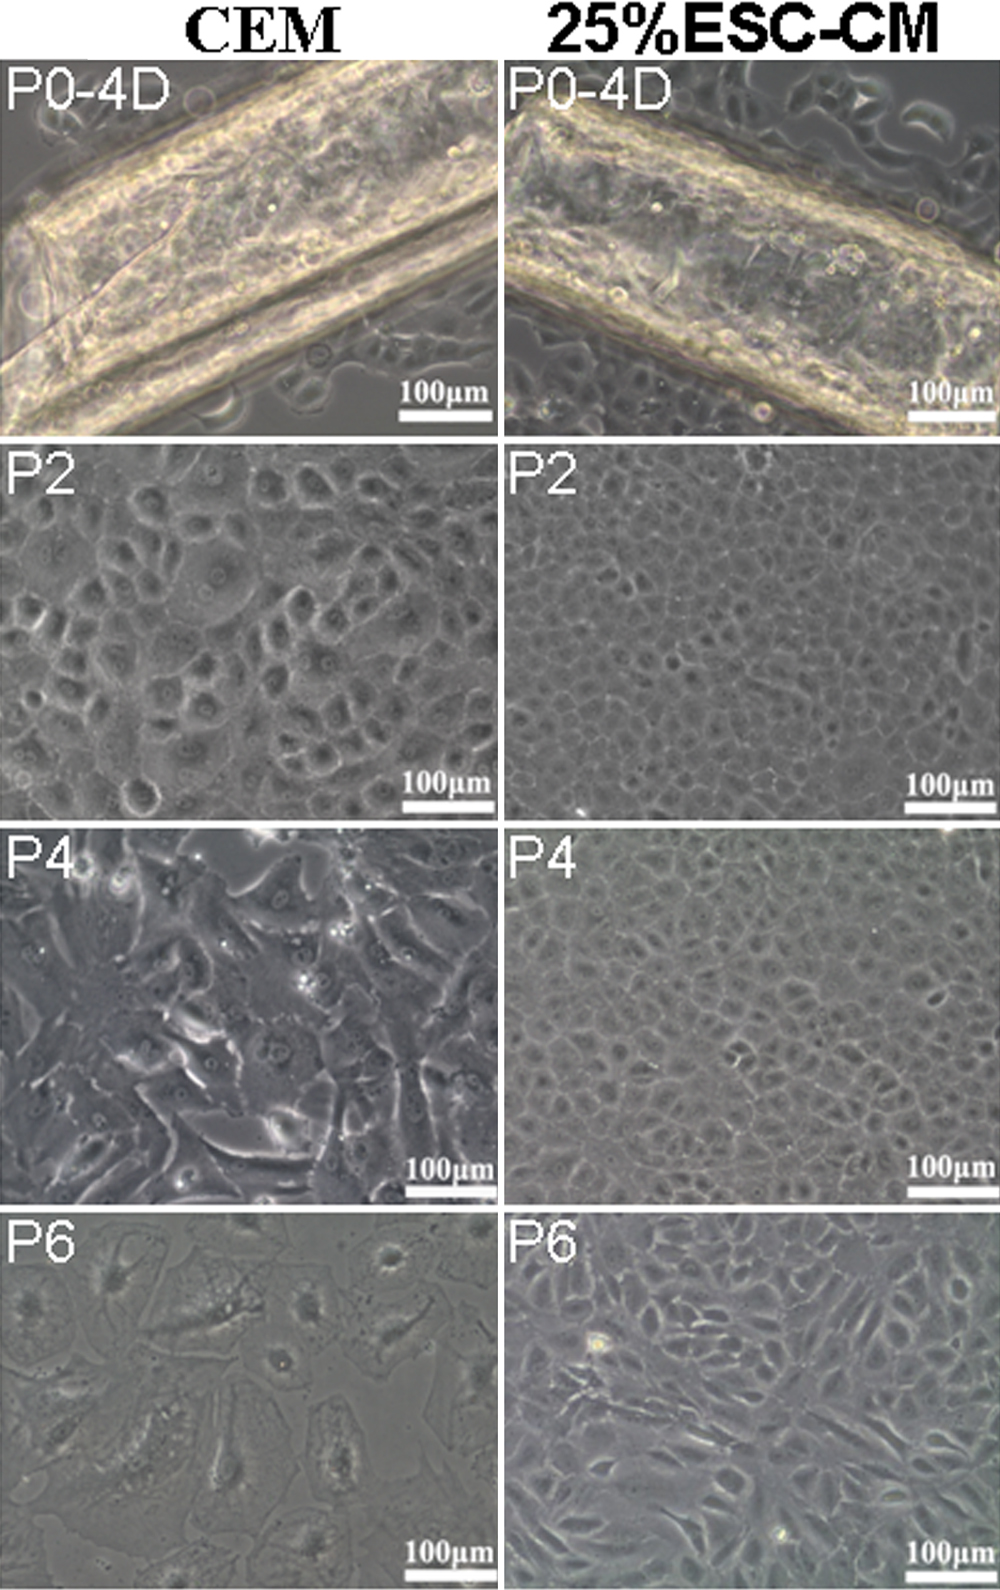
Figure 3.
The morphology and cell size of HCECs cultured in the CEM group and the 25%ESC-CM group. The 25%ESC-CM group maintained the morphology and cell size of HCECs until passage (P6).
 Figure 3 of
Lu, Mol Vis 2010; 16:611-622.
Figure 3 of
Lu, Mol Vis 2010; 16:611-622.