Figure 1. Cell number in three different mediums. The HCECs were seeded at the density of 9×10⁴ cells/well on 12-well plates. The ESC-CM and ESC medium were added to passage 1 cells. Data are expressed as the mean±SEM
(n=3). The values with the same letter (a, b, c, d) in each column indicate these values are not significantly different (p>0.05).
The same indication is used in all subsequent figures.
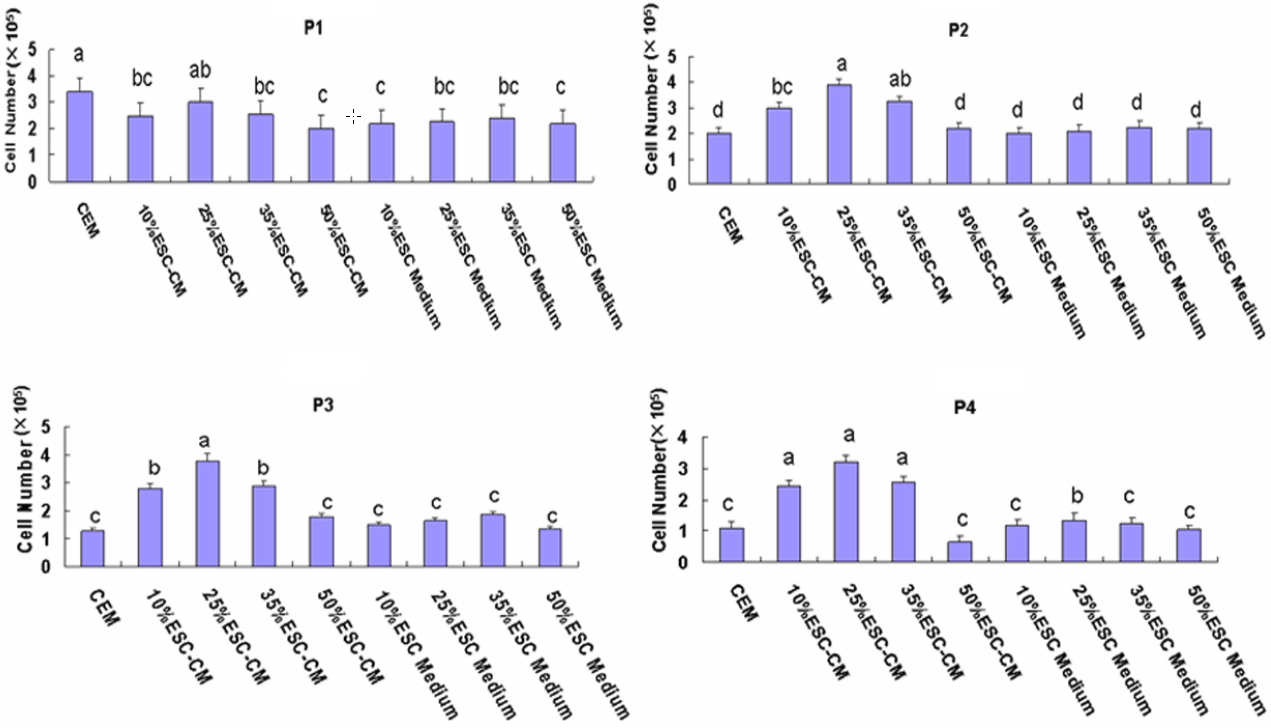
 Figure 1 of
Lu, Mol Vis 2010; 16:611-622.
Figure 1 of
Lu, Mol Vis 2010; 16:611-622.