Figure 1. Random forest analysis
demonstrates the relative importance of individual cytokines in
classifying different study groups.Random forest analysis of data set 1
(A) and data set 2 (B) demonstrating the relative
importance of individual cytokines in classifying aqueous humor from
different study groups. The individual plots represent the relative
importance of the cytokines in the overall classification. The vertical
axes represent individual cytokines sorted by importance. The
horizontal axes represent the average decrease in classification
accuracy. Abbreviations: IL=interleukin, TNF=tumor necrosis factor,
INF=interferon.
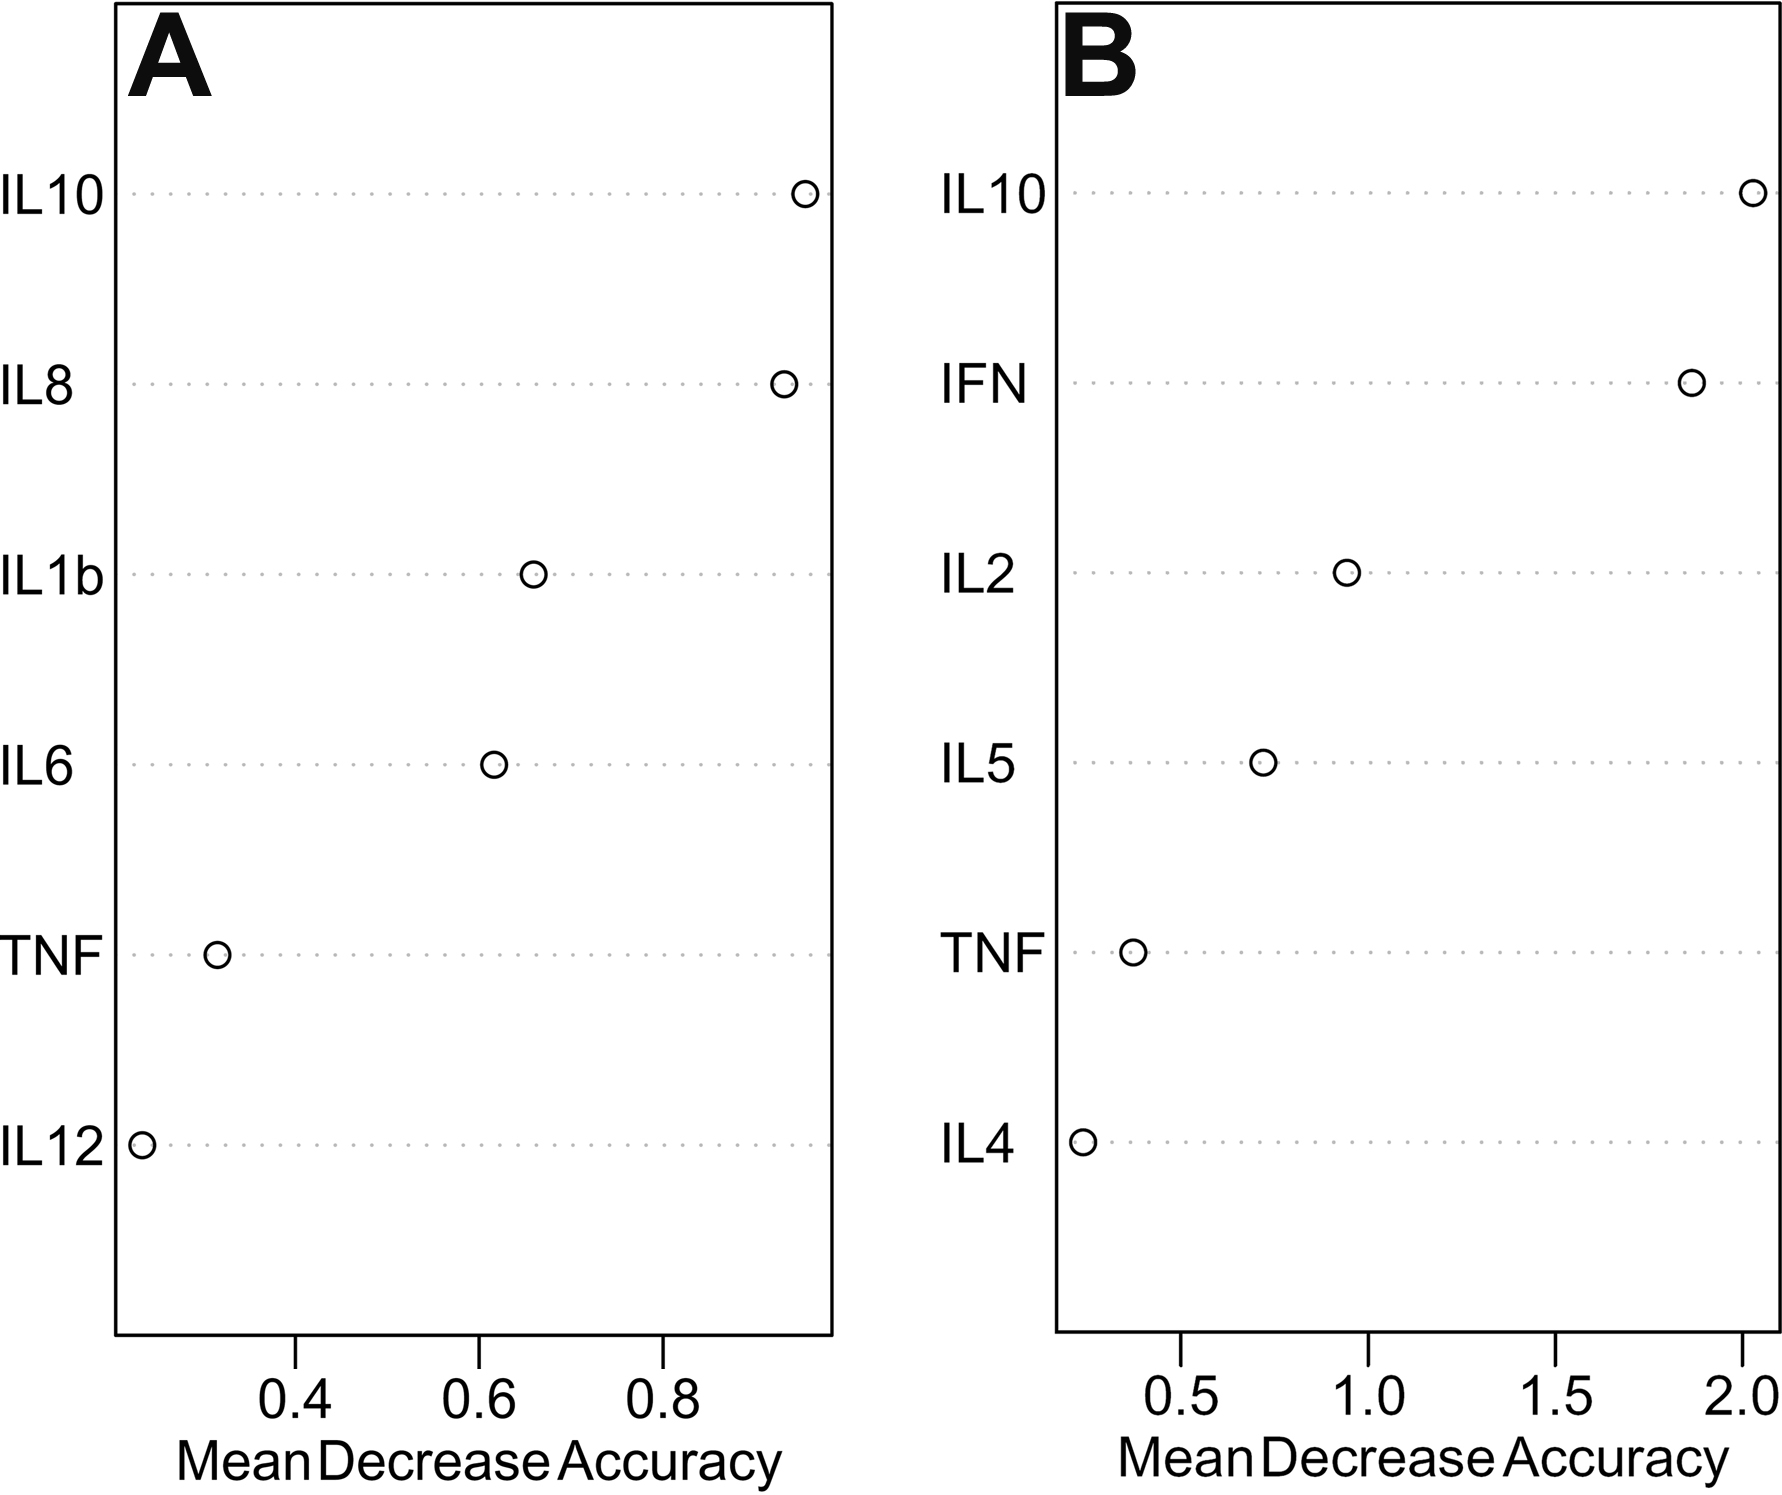
 Figure 1 of Maier, Mol Vis 2010; 16:53-60.